AI Infra Workbook: 5 Hands-On LLM + Kubernetes Projects
How to use this workbook
Five projects build one stack, from an LLM that writes Dockerfiles to GPU inference that scales to zero. Do them in order: each project reuses something the previous one produced, and each ends with checkpoints you tick only after you have verified them on a real cluster.
Every project follows the same six parts:
- Summary: what you build and why it matters in production.
- Approach: the design decisions, and the reasoning behind each.
- Build steps: numbered, with the commands and config that matter.
- Checkpoints: tick when verified, not when typed.
- Break it: failure drills that teach more than the happy path.
- Blog prompts: what to write up from your own results.
| # | Project | Layer it adds | Core tools | GPU needed |
|---|---|---|---|---|
| 1 | Dockerfile generation with an LLM | Tooling | Python, Ollama, Docker | No |
| 2 | Production LLM serving on Kubernetes | Serving | vLLM, Helm, Prometheus, Grafana | Yes |
| 3 | End-to-end DevOps + AIOps | Delivery and operations | GitHub Actions, Argo CD, Prometheus, Loki | No |
| 4 | GPU auto-scaling inference | Elasticity | KServe, k6 | Yes |
| 5 | Scale-to-zero inference | Cost | KEDA, Redis, vLLM | Yes |
Lab setup
You need one Kubernetes cluster with a GPU node for projects 2, 4 and 5; projects 1 and 3 run fine on a laptop. Pin every version you use and write it in your post, because vLLM, KServe and KEDA release quickly and older tutorials break.
| Tool | Used in | Purpose |
|---|---|---|
| Docker, kind or minikube | 1, 3 | Local builds and a throwaway cluster |
| Ollama | 1 | Local LLM for Dockerfile generation |
| kubectl, Helm | 2 to 5 | Cluster access and chart installs |
| NVIDIA GPU Operator | 2, 4, 5 | Drivers, device plugin and metrics on GPU nodes |
| Prometheus, Grafana, Loki | 2, 3 | Metrics, dashboards and logs |
| Argo CD | 3 | GitOps sync from Git to the cluster |
| KServe, k6 | 4 | Model serving and load generation |
| KEDA, Redis | 5 | Event-driven scaling and the job queue |
Recommended repo layout, one folder per project plus shared config:
ai-infra-workbook/
  p1-dockerfile-gen/
  p2-vllm-stack/
  p3-devops-aiops/
  p4-gpu-autoscale/
  p5-scale-to-zero/
  shared/        # namespaces, monitoring values, model-cache PVC
Before project 2, confirm the base is healthy:
kubectl get nodesshows the GPU node Readykubectl describe node <gpu-node>listsnvidia.com/gpuunder Capacity- A test pod running
nvidia-smicompletes successfully - Prometheus and Grafana are installed in a
monitoringnamespace - A model-cache PVC exists so weights download once, not per pod
Project 1: Dockerfile generation using an LLM
Summary. A Python script (gen_dockerfile.py) reads an app folder, sends its manifests and file tree to a local model served by Ollama, and writes a Dockerfile. The LLM only proposes; hadolint and docker build decide whether the result is accepted. This is the safest first use of an LLM in infrastructure work, because every output is machine-verified.
Flow. my-app/ folder, then the script, then Ollama, then a Dockerfile, then lint and build, with failures fed back to the model.
Approach
| Decision | Choice | Why |
|---|---|---|
| Model location | Local model through Ollama | Source code never leaves the machine |
| Determinism | Temperature 0 and a fixed rule list in the system prompt | Same app should give the same Dockerfile |
| Context sent | File tree plus manifests only, capped in size | Keeps the prompt small and avoids leaking secrets |
| Validation | hadolint, then docker build | The toolchain is the source of truth, not the model |
| Retries | Feed the error back, maximum 3 attempts | Bounded cost and no infinite loops |
Build steps
- Install Ollama and pull a code model:
ollama pull qwen2.5-coder:7b. Any instruction-tuned code model works; note which one you used. - Write a scanner that collects
requirements.txt,package.json,go.modorpyproject.toml, plus a file tree, each truncated to about 2,000 characters. - Write the system prompt with hard rules: pinned slim base image, multi-stage build where it applies, non-root user, no secrets in layers,
.dockerignorerespected, and output only a single fenced Dockerfile. - Call the Ollama chat API and extract the fenced block.
- Run
hadolint Dockerfile, thendocker build -t test-app .. - On failure, send the Dockerfile and the error text back to the model and repeat up to 3 times.
Core of the script:
import pathlib, requests

OLLAMA = "http://localhost:11434/api/chat"
MODEL = "qwen2.5-coder:7b"

def scan(app: pathlib.Path) -> str:
    keep = ["requirements.txt", "pyproject.toml", "package.json", "go.mod"]
    parts = [f"## {n}\n{(app/n).read_text()[:2000]}" for n in keep if (app/n).exists()]
    tree = [str(p.relative_to(app)) for p in app.rglob("*") if p.is_file() and ".git" not in p.parts]
    parts.append("## tree\n" + "\n".join(tree)[:2000])
    return "\n\n".join(parts)

def ask(system: str, user: str) -> str:
    r = requests.post(OLLAMA, json={
        "model": MODEL, "stream": False, "options": {"temperature": 0},
        "messages": [{"role": "system", "content": system},
                     {"role": "user", "content": user}]}, timeout=300)
    return r.json()["message"]["content"]
Checkpoints
- The script produces a Dockerfile for a Flask or FastAPI sample app that builds on the first or second attempt
- The container runs as a non-root user (
docker run --rm test-app id) hadolintreports no errors on the final Dockerfile- A deliberately broken prompt (missing rules) produces a visibly worse Dockerfile, proving the rules matter
- Failed builds trigger the repair loop and stop after 3 attempts
Break it
- Add a fake
.envwith a token to the app folder and confirm it never appears in the prompt or the image. - Try a Node app, then a Go app, and note where the 7B model gets multi-stage builds wrong.
- Swap the model for a smaller one and measure how many attempts the repair loop needs.
Blog prompts
- Success rate by model size across 5 sample apps, as a small table.
- Why “LLM proposes, toolchain disposes” is the pattern to reuse in every later project.
- The three most common mistakes the model made, and the prompt rule that fixed each.
Project 2: Production LLM serving stack on Kubernetes
Summary. Deploy vLLM as three replicas behind a router, installed with Helm, with Prometheus and Grafana watching it. Clients talk to one OpenAI-compatible endpoint; the router spreads requests across replicas. This is the baseline every later project scales, so measure it carefully.
Flow. Client, then the vLLM router, then replicas 1 to 3 (each holding the model on a GPU), with metrics flowing to Prometheus and Grafana.
Approach
| Decision | Choice | Why |
|---|---|---|
| Packaging | Helm chart (vLLM production-stack) | Router, engines and monitoring in one versioned release |
| Model | Small open model such as Qwen/Qwen2.5-1.5B-Instruct | No gated-model token, fits one modest GPU, quick to reload |
| Replicas | 3, one GPU each | Enough to see routing and failure behavior |
| Routing | Round-robin first, session affinity second | Compare both under the same load |
| Weights | Shared PVC cache | Restarts reuse downloaded weights |
| Metrics | Scrape router and engines | You need baselines before project 4 |
Build steps
- Add the chart repo:
helm repo add vllm https://vllm-project.github.io/production-stack. - Write
values.yamlwith one model spec, three replicas and a router. Check the chart’s default values for your version, since key names change. - Install:
helm install vllm vllm/vllm-stack -f values.yaml -n llm --create-namespace. - Wait for pods, then port-forward the router service and list models with
curl localhost:30080/v1/models. - Send a chat completion, then watch which replica logged it.
- Import a Grafana dashboard for vLLM and confirm the panels fill.
Starting point for values.yaml:
servingEngineSpec:
  modelSpec:
    - name: "qwen"
      repository: "vllm/vllm-openai"
      tag: "<pinned-version>"
      modelURL: "Qwen/Qwen2.5-1.5B-Instruct"
      replicaCount: 3
      requestCPU: 4
      requestMemory: "16Gi"
      requestGPU: 1
      pvcStorage: "30Gi"
      vllmConfig:
        maxModelLen: 4096
routerSpec:
  routingLogic: "roundrobin"
Metrics worth a Grafana panel each: requests running, requests waiting, KV-cache usage, time to first token, and tokens per second. Exact metric names differ between vLLM versions, so confirm them at the /metrics endpoint.
Checkpoints
- All three engine pods are Ready and each reports a GPU in
kubectl describe pod - Ten identical requests land on more than one replica
- Grafana shows time to first token and queue depth moving under a simple loop of requests
- Deleting one replica pod causes no failed client requests after the router notices
- A pod restart reloads weights from the PVC instead of downloading again
Break it
- Set
maxModelLentoo high and read the out-of-memory error until you can explain it. - Send one very long prompt while short ones run, and watch queue depth and latency for the others.
- Switch to session affinity and repeat a multi-turn chat to see the effect on cache hits.
Blog prompts
- A baseline table: requests per second, p50 and p95 time to first token, with 1 versus 3 replicas.
- What the router adds over a plain Kubernetes Service, and when you would not need it.
- Why GPU memory, not compute, usually decides how many requests fit.
Project 3: End-to-end DevOps + AIOps
Summary. Build a full delivery loop, then close it with an LLM. A push to GitHub triggers GitHub Actions, which builds an image and updates a GitOps repo; Argo CD syncs it to Kubernetes. When something breaks, Prometheus and Loki supply evidence, an LLM writes a root-cause summary, and the alert arrives with the diagnosis attached.
Flow. Delivery: GitHub, Actions, Argo CD, Kubernetes. Operations: Prometheus and Loki, then AI root cause, then the alert, sent to a human.
Approach
| Decision | Choice | Why |
|---|---|---|
| Deploy model | GitOps: CI never touches the cluster | Git is the audit trail; Argo CD fixes drift |
| Image tag | Commit SHA, never latest | Every incident maps to one commit |
| AIOps trigger | Alertmanager webhook | Reuses alerts you already trust |
| Evidence | Metrics, logs, recent deploy diff, pod events | An LLM without evidence guesses |
| Output | Structured JSON, then a Slack message | Predictable format, easy to evaluate |
| Authority | Read-only; no auto-remediation | Earn trust before granting write access |
Build steps
- Create two repos: the app repo and a GitOps repo holding Kubernetes manifests or a Helm chart.
- Write a GitHub Actions workflow that tests, builds, pushes
ghcr.io/<you>/<app>:<sha>, then commits the new tag to the GitOps repo. - Install Argo CD and create an Application pointing at the GitOps repo with automated sync.
- Install Prometheus and Loki, and add alert rules for error rate, latency and restarts.
- Build a small RCA service that receives the Alertmanager webhook and gathers: the alert labels, PromQL results for the last 30 minutes, the last 100 error log lines from Loki, the previous and current Argo CD revisions with their Git diff, and recent pod events.
- Send that bundle to your LLM (the project 2 endpoint works) with a prompt asking for
summary,likely_cause,evidence,confidenceandnext_checksas JSON. - Post the result to Slack with the alert.
Minimal Argo CD Application:
apiVersion: argoproj.io/v1alpha1
kind: Application
metadata:
  name: my-app
  namespace: argocd
spec:
  project: default
  source:
    repoURL: https://github.com/<you>/gitops
    targetRevision: main
    path: apps/my-app
  destination:
    server: https://kubernetes.default.svc
    namespace: my-app
  syncPolicy:
    automated: {prune: true, selfHeal: true}
Checkpoints
- A commit to
mainreaches the cluster with no manualkubectlstep - Manually editing a Deployment in the cluster is reverted by Argo CD (self-heal)
- A bad commit (crash on startup) fires an alert within your target time
- The Slack message names the failing commit and quotes at least one log line as evidence
- The RCA output parses as valid JSON on 10 out of 10 test alerts
Break it
- Ship a commit that raises latency without crashing, and see whether the RCA blames the right change.
- Remove logs from the bundle and compare the quality of the diagnosis with and without them.
- Inject an instruction into a log line (“ignore previous instructions”) and confirm the service treats logs as data, not commands.
Blog prompts
- Time from commit to running pod, and from fault to Slack message, as two measured numbers.
- A scorecard of 10 injected faults: how many times the RCA was right, partly right, or wrong.
- Why the AI stays read-only, and what evidence would justify giving it more authority.
Project 4: GPU auto-scaling inference system
Summary. Serve a model with KServe and let Kubernetes add and remove GPU replicas as load changes. A k6 test ramps traffic up and down while you watch replicas, GPU nodes and latency respond. The lesson is choosing the right scaling signal and accepting that GPU replicas take minutes, not seconds, to arrive.
Flow. k6 load test, then KServe, then GPU node 1, 2 and 3 appearing as demand grows.
Approach
| Decision | Choice | Why |
|---|---|---|
| Serving layer | KServe InferenceService with the Hugging Face runtime | Declarative model serving with built-in autoscaling hooks |
| Scaling signal | Concurrent requests per replica | Tracks real load; GPU utilization stays high even when overloaded |
| Bounds | minReplicas: 1, maxReplicas: 3 | One warm replica avoids cold starts; the max caps cost |
| Node scaling | Cluster autoscaler or Karpenter on a GPU node group | Pods stay Pending until a node exists |
| Goal | An SLO: p95 latency under a stated limit | Scaling is judged against a target, not by feel |
| Signal | Good for LLMs? | Note |
|---|---|---|
| Concurrency per replica | Yes | Simple and reacts early |
| Requests waiting in the queue | Best | Needs a custom metric through KEDA or HPA |
| Requests per second | Partly | Ignores prompt and output length |
| GPU utilization | Poor | Saturates quickly and says little about queueing |
Build steps
- Install KServe and its dependencies, and confirm the GPU node group can scale from 1 to 3.
- Deploy the
InferenceServicebelow and call it once to confirm it answers. - Write the k6 script and run a baseline at low load, recording p95 latency.
- Run the ramp: up, hold, then down. Watch
kubectl get pods -wand the node list in a second terminal. - Record when each replica became Ready, and how long the slowest one took from Pending.
- Tune the target and scale-down delay, and rerun.
apiVersion: serving.kserve.io/v1beta1
kind: InferenceService
metadata:
  name: qwen
spec:
  predictor:
    minReplicas: 1
    maxReplicas: 3
    scaleMetric: concurrency
    scaleTarget: 8
    model:
      modelFormat:
        name: huggingface
      storageUri: hf://Qwen/Qwen2.5-1.5B-Instruct
      resources:
        limits:
          nvidia.com/gpu: "1"
k6 ramp, rate-based so slow responses do not hide overload:
import http from 'k6/http';

export const options = {
  scenarios: {
    ramp: {
      executor: 'ramping-arrival-rate',
      startRate: 1, timeUnit: '1s',
      preAllocatedVUs: 50, maxVUs: 200,
      stages: [
        { target: 5, duration: '2m' },
        { target: 20, duration: '5m' },
        { target: 20, duration: '5m' },
        { target: 2, duration: '5m' },
      ],
    },
  },
  thresholds: { http_req_duration: ['p(95)<5000'] },
};

export default function () {
  const body = JSON.stringify({
    model: 'qwen',
    messages: [{ role: 'user', content: 'Explain Kubernetes in 100 words' }],
    max_tokens: 128,
  });
  http.post(`${__ENV.URL}/openai/v1/chat/completions`, body,
    { headers: { 'Content-Type': 'application/json' } });
}
Checkpoints
- Baseline p95 latency is recorded at one replica before any ramp
- Replicas rise from 1 to 3 during the ramp and fall back after the hold
- You have a measured time from scale decision to Ready for a replica on an existing node and on a new node
- The k6 threshold fails when scaling is disabled, and passes when enabled
- Scale-down does not flap: no more than one scale-down event per quiet period
Break it
- Set
scaleTargetfar too high and watch latency breach the SLO before any scale-up. - Set
maxReplicasabove the GPU quota and read the Pending pod events. - Send long prompts instead of short ones and see how the same concurrency target behaves.
Blog prompts
- A timeline chart from your run: load, replica count and p95 latency on one time axis.
- Why GPU utilization is a poor autoscaling signal, with your own numbers.
- The cold-start budget: node provisioning, image pull and weight load, each timed.
Project 5: Scale-to-zero inference with KEDA
Summary. Run the model only when there is work. Clients push jobs onto a Redis queue; KEDA watches the queue length and starts a vLLM pod when the first job arrives, then scales back to zero replicas after the queue drains. You trade a cold start for a GPU bill of nothing while idle, which suits batch and internal workloads.
Flow. Client, then the Redis queue, then KEDA, then vLLM at 0 replicas, scaling up when jobs are waiting.
Approach
| Decision | Choice | Why |
|---|---|---|
| Request pattern | Asynchronous: enqueue a job, poll for the result | With zero pods there is nothing to answer an HTTP call |
| Trigger | KEDA Redis list scaler | Queue length is a direct measure of pending work |
| Pod layout | vLLM container plus a small worker sidecar | The worker pulls jobs and calls vLLM on localhost |
| Scaling range | 0 to 3 replicas | KEDA handles 0 to 1; the HPA it creates handles 1 to N |
| Cold start | Weights on a PVC and images pre-pulled | Cuts the delay to the model load itself |
| Safety | Reliable queue pattern (move job to a processing list) | A pod killed mid-job must not lose it |
For interactive traffic that must scale to zero, use the KEDA HTTP add-on instead, which holds requests while a pod starts.
Build steps
- Install KEDA with Helm and Redis in a
queuenamespace. - Deploy the vLLM worker pod: a vLLM container and a sidecar that waits for vLLM readiness, then loops over jobs.
- Create the
ScaledObjectbelow withminReplicaCount: 0. - Confirm the Deployment sits at 0 replicas when the queue is empty.
- Push 10 jobs, watch a pod start, and time how long the first result takes.
- Let the queue drain and time how long until replicas return to 0.
apiVersion: keda.sh/v1alpha1
kind: ScaledObject
metadata:
  name: vllm-worker
spec:
  scaleTargetRef:
    name: vllm-worker
  minReplicaCount: 0
  maxReplicaCount: 3
  pollingInterval: 15
  cooldownPeriod: 300
  triggers:
    - type: redis
      metadata:
        address: redis.queue.svc:6379
        listName: jobs
        listLength: "5"
        activationListLength: "1"
Sidecar worker, simplest version (it loses a job if the pod dies mid-request; Break it covers that):
import json, redis, requests

r = redis.Redis(host="redis.queue.svc", port=6379)
while True:
    _, raw = r.blpop("jobs")
    job = json.loads(raw)
    resp = requests.post("http://localhost:8000/v1/chat/completions",
                         json=job["request"], timeout=600)
    r.set(f"result:{job['id']}", resp.text, ex=3600)
Checkpoints
- With an empty queue,
kubectl get deploy vllm-workershows 0 replicas and the GPU is free - One job wakes a pod, and its result appears in Redis
- 30 queued jobs scale the Deployment above 1 replica
- Replicas return to 0 after the cooldown period passes with an empty queue
- You have a measured cold-start time from first job to first result
Break it
- Kill the pod mid-job and see which job vanished, then switch the worker to move jobs to a processing list before working on them.
- Set
cooldownPeriodto 30 seconds and push jobs in bursts to see flapping and repeated cold starts. - Delete the model PVC and compare cold start with and without cached weights.
Blog prompts
- Cost comparison: an always-on GPU replica versus scale-to-zero for a workload with 2 hours of real work per day.
- The cold-start breakdown: scheduling, image pull, weight load and first token, each timed.
- When scale-to-zero is the wrong choice, and what latency target rules it out.
Putting it together
The five projects form one platform: project 1 packages the app, project 3 ships it, project 2 serves the model it calls, and projects 4 and 5 decide how much GPU that model gets and when. Each project’s numbers become the next one’s starting point.
| Project | Feeds into | What you carry forward |
|---|---|---|
| 1 Dockerfile generation | 3 | A repeatable way to containerize apps |
| 2 LLM serving stack | 3, 4, 5 | A working endpoint and baseline latency numbers |
| 3 DevOps + AIOps | Whole platform | GitOps delivery, observability and a read-only RCA assistant |
| 4 GPU auto-scaling | 5 | The right scaling signal and a cold-start budget |
| 5 Scale-to-zero | Whole platform | A cost floor of zero for async workloads |
Failure modes seen across all five
- Unpinned versions.
latesttags and chart defaults change under you; pin and record them. - Trusting model output. Every LLM step here has a verifier: a build, a JSON parse, a human reader.
- Slow GPUs to start. Node, image and weights each add minutes; time all three.
- Wrong metric. Scaling on GPU utilization or CPU hides queueing; use concurrency or queue depth.
- Cache loss. Without a weights PVC, every restart is a fresh download.
Final self-assessment
- I can explain why the LLM proposes and a tool verifies in projects 1 and 3
- I have a measured baseline for latency, throughput and cold start
- I can state which signal each autoscaler uses and why
- I have one chart that shows load, replicas and latency together
- Each project has its repo folder, pinned versions and a short write-up
- I know which workload suits always-on, autoscaled or scale-to-zero, and can defend the choice with numbers
NVIDIA GPU Workloads on Kubernetes — Part 3: What Happens Inside the Cluster After Operators Deploy
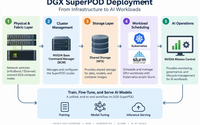
DGX SuperPOD Deployment Guide: BCM, Kubernetes & Slurm
GPUs, Slurm, and Kubernetes: The Building Blocks of Modern HPC and AI Infrastructure
About Author

abhishek
Cloud Platform Lead and AI Infrastructure Architect at e& enterprise, with 12+ years in data center, virtualization, security and AI infrastructure. I design and build private cloud and sovereign AI platforms, working with VMware (NSX-T, vSphere, vSAN, HCX, AVS, SRM), Kubernetes, Terraform and GPU inference infrastructure for LLMs. Previously served Networkers Home (CCIE instructor, trained around 50 CCIEs), VCE/EMC2, Cisco, VMware and Arista across TAC, consulting, design and training. Certifications: CCIE#48639 (Data Center and R&S), VCIX-DCV and NV, CKA, NVIDIA AI Infrastructure, Azure Solutions Architect Expert, Terraform Associate, Palo Alto PCNSE. LinkedIn: https://www.linkedin.com/in/abhishekkunal51/