Part 4 of “vLLM in 2026: An Infrastructure Engineer’s Field Guide”
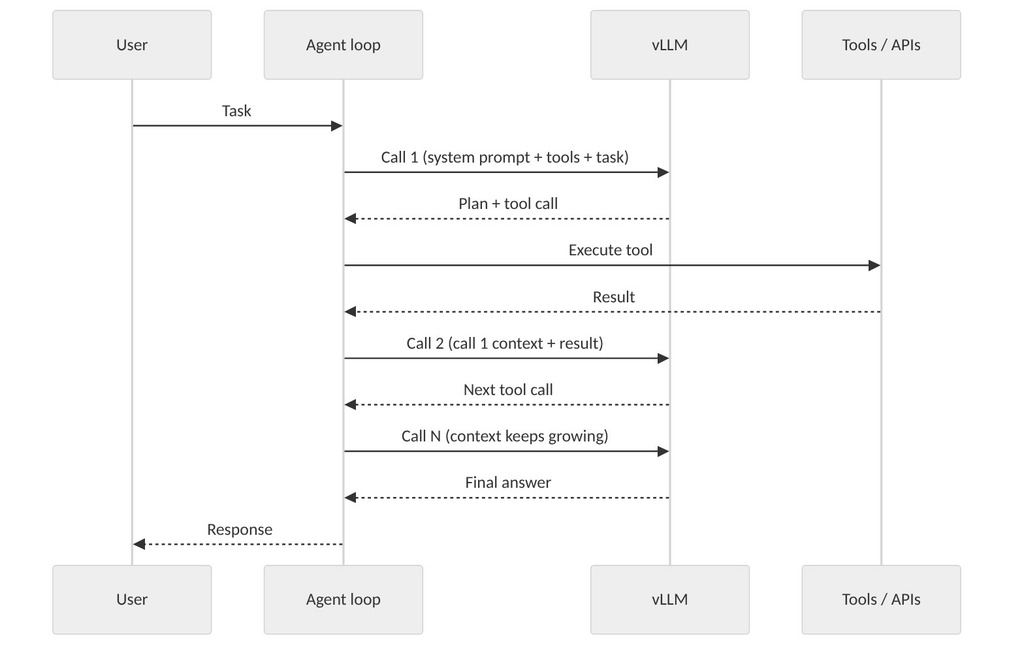
Capacity planning for chat was relatively simple: users send a prompt, the model streams an answer, and you size for concurrent conversations. Agents change the traffic shape completely. A single user request can fan out into dozens of model calls, each with a growing context, interleaved with tool calls that leave the GPU idle while an API responds.
If you size an agent platform the way you sized a chatbot, you will either overspend or fall over. This post explains why, and which vLLM features and metrics matter.
[Add from talks: “Serving vLLM on Agentic Production Workloads” (Inferact) and “Lightning on Agentic” (Embedded LM, Anyscale, Novita, Verda): production traffic statistics, cache hit rates observed, provider-side economics, scaling lessons.]
Compared with chat, the differences are structural:
Property
Chat
Agent
Calls per user task
1 per turn
Often 10s, sometimes 100s
Context growth
Slow
Rapid: every tool result is appended
Prompt/output ratio
Moderate
Heavily prefill-dominated: huge inputs, short outputs (often just a tool call)
Shared content across calls
Some
Very high: system prompt, tool schemas, and earlier turns repeat verbatim
Output format
Free text
Frequently structured (JSON tool calls)
Arrival pattern
Smooth-ish
Bursty; parallel sub-agents spike concurrency
GPU idle gaps
Rare
Between calls while tools run
The big consequence: most of your compute is wasted re-reading text the model has already seen unless you cache it.
2. Prefix caching: the single biggest lever
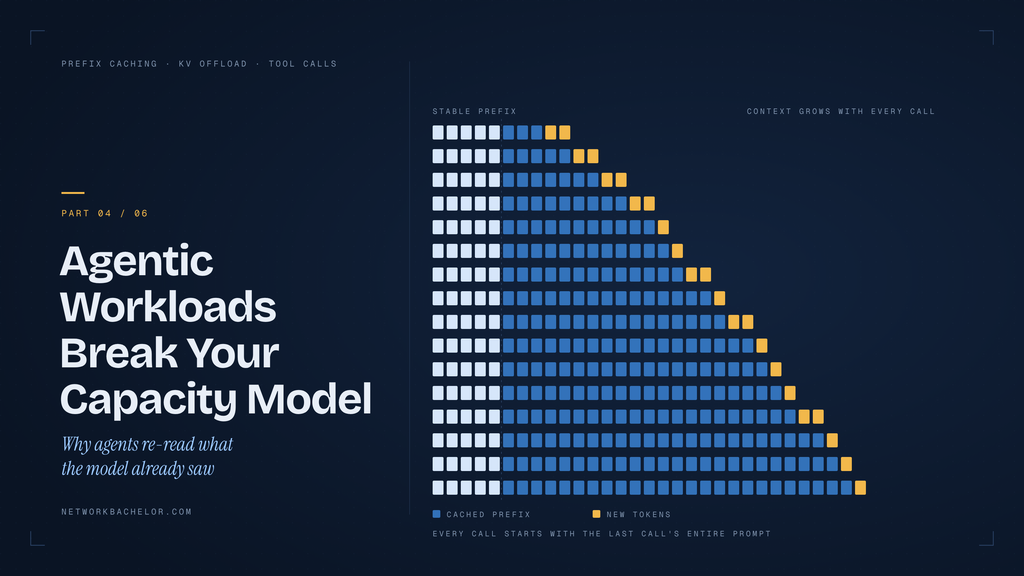
Recall PagedAttention (Post 1): identical prefixes can share KV blocks. In an agent loop, call N’s prompt begins with call N-1’s entire prompt. Without caching, every call re-prefills all of it.
Illustration with round numbers: suppose the shared prefix (system prompt, tool definitions, prior turns) is 20K tokens and each step adds 500 new tokens.
Without caching: each call prefills about 20K tokens.
With a warm cache: each call prefills about 500 new tokens, roughly 40x less prefill work.
Prefix caching is enabled by default in recent vLLM versions, but whether it works depends on your system:
Routing. If a load balancer sends call N+1 to a different replica than call N, the cache is cold. This is why cache-aware routing (Post 3) matters so much for agents. Session affinity is the minimum; prefix-aware routing is better.
Prompt hygiene. Caching matches exact token prefixes. Anything that changes early in the prompt (a timestamp, a request ID, reordered tools) invalidates everything after it. Put stable content first and volatile content last.
Cache capacity. GPU KV memory is finite. Long-lived sessions get evicted under pressure, then re-prefilled.
3. KV cache offload: extending the cache tier
When the working set of active sessions exceeds GPU memory, you have two choices: evict and recompute, or offload KV blocks to a cheaper tier (CPU RAM, then local NVMe or a network cache) and load them back on demand.
The trade is transfer time versus recompute time. Loading a cached prefix over PCIe or a network can beat recomputing a long prefill, especially for large contexts, but only if the link is fast enough. Sizing math from Post 3 applies: a 20K-token prefix on an 8B-class model is roughly 2.5 GiB of KV, so bandwidth matters.
vLLM supports KV connectors and offload integrations (including third-party cache layers). Check the current documentation for which backends your version supports.
[Add from talk: any measured hit-rate or latency gains from offload in production agent traffic.]
4. Structured output and tool calling
Agents need machine-parseable output. Two features matter:
Tool/function calling. vLLM can parse model output into OpenAI-style tool calls; you must enable it and choose the parser that matches the model family:
vllm serve <model> \
  --enable-auto-tool-choice \
  --tool-call-parser hermes   # parser depends on the model family
Constrained (structured) decoding. Enforce a JSON schema or grammar so the model can’t produce malformed output. This costs some overhead per token; measure it on your workload.
Operationally: malformed tool calls are a top source of agent failures and retries, and each retry is another full round trip through your capacity budget.
5. Speculative decoding for short outputs
Agent outputs are short and often highly predictable (tool names, JSON boilerplate). That is a good fit for speculative decoding, where a cheap draft proposes tokens and the target model verifies several at once. Post 6 covers how it works; here the point is that decode-side savings compound over hundreds of calls.
6. Right-sizing: metrics that matter for agents
Stop measuring only tokens per second. For agents, track:
Cost per completed task, not per token. A cheaper token doesn’t help if the agent takes 3x the steps.
Prefix cache hit rate (per model, per tenant). Your most important efficiency number.
Time to first token at long contexts. Prefill dominates; watch p95/p99 as contexts grow.
Queue time under burst. Parallel sub-agents create spikes; measure how fast your system absorbs them.
Calls per task and context length per call, the demand-side numbers you plan capacity from.
GPU idle fraction. Tool latency leaves gaps; keep GPUs busy by multiplexing many sessions rather than dedicating capacity per agent.
A capacity model that works:
GPU-seconds per task ≈ Σ over calls (uncached prefill tokens / prefill rate + output tokens / decode rate)
Then apply your measured cache hit rate to the prefill term. Small changes in hit rate move that number dramatically.
7. The provider view
For inference providers and GPU clouds serving many tenants, agents amplify multi-tenancy problems: one tenant’s long-context burst can hurt others’ latency. Mitigations include per-tenant rate limits and token budgets, priority classes, isolating heavy-context workloads onto separate pools, and autoscaling on queue depth and KV pressure rather than request count.
[Add from talk: the provider panel’s real-world lessons: pricing models, SLA choices, autoscaling policies, what broke first.]
Design-review checklist
Have we measured calls per task and context length distribution from real agent traces?
Is routing cache-aware (or at least session-sticky)?
Are prompts structured stable-first, volatile-last, and versioned so cache-breaking changes are visible?
Do we track prefix cache hit rate and alert on drops?
Have we sized the offload tier’s bandwidth against KV sizes?
Are tool-call parse failures and retries measured?
Cloud Platform Lead and AI Infrastructure Architect at e& enterprise, with 12+ years in data center, virtualization, security and AI infrastructure. I design and build private cloud and sovereign AI platforms, working with VMware (NSX-T, vSphere, vSAN, HCX, AVS, SRM), Kubernetes, Terraform and GPU inference infrastructure for LLMs. Previously served Networkers Home (CCIE instructor, trained around 50 CCIEs), VCE/EMC2, Cisco, VMware and Arista across TAC, consulting, design and training. Certifications: CCIE#48639 (Data Center and R&S), VCIX-DCV and NV, CKA, NVIDIA AI Infrastructure, Azure Solutions Architect Expert, Terraform Associate, Palo Alto PCNSE. LinkedIn: https://www.linkedin.com/in/abhishekkunal51/