GPUs, Slurm, and Kubernetes: The Building Blocks of Modern HPC and AI Infrastructure
Every large-scale AI system — the model that answers your question, the recommendation engine on your favorite app, the vision model in a self-driving car — was trained and is served on infrastructure built from three foundational pieces: GPUs that do the actual computation, a scheduler that decides who gets to use them and when, and an orchestration layer that keeps the applications running reliably around that compute. This post explains each piece on its own terms, then shows how they fit together into the systems that power modern AI.
What is a GPU, and why does AI need it?
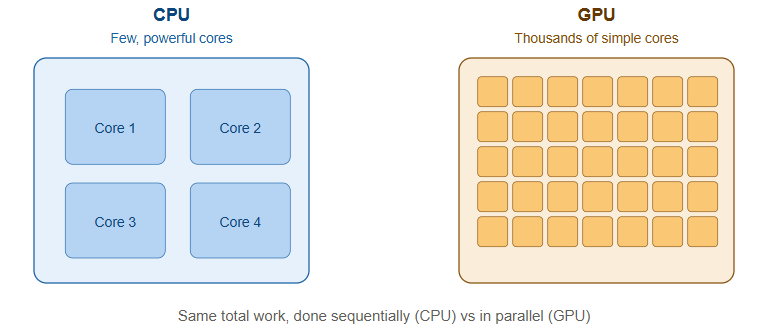
A GPU (Graphics Processing Unit) was originally built to render graphics for video games — drawing millions of pixels at once, in parallel. That same property, doing thousands of simple calculations simultaneously rather than one complex calculation at a time, turns out to be exactly what’s needed for AI.
Training or running a neural network is, at its core, an enormous number of matrix multiplications — the same operation repeated millions or billions of times across huge grids of numbers. A CPU (Central Processing Unit) is built to do a small number of complex tasks very fast, one after another, with a handful of powerful cores (typically 8 to 128). A GPU flips that trade-off: it has thousands of smaller, simpler cores that all execute the same instruction on different pieces of data at the same time. For matrix multiplication at AI scale, that parallelism turns a task that would take a CPU days into one a GPU can do in hours or minutes.
A few terms worth knowing:
- VRAM (video memory) is the GPU’s own high-speed memory, separate from the server’s regular system memory. Large AI models need to fit their parameters (the numbers the model has learned) into VRAM, which is why GPU memory capacity is one of the first numbers people quote when discussing which models a given GPU can run.
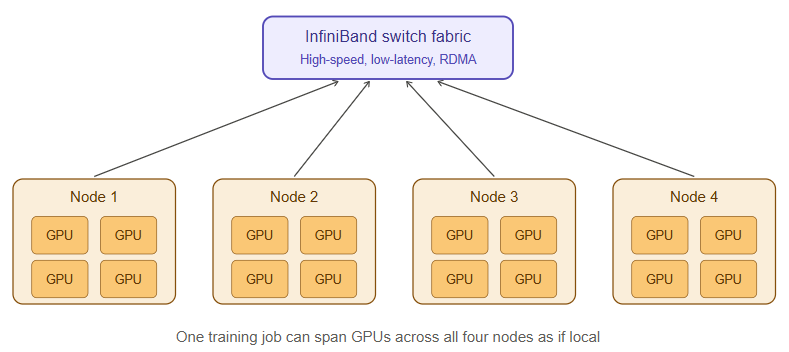
- A GPU cluster is a group of servers, each containing multiple GPUs, networked together so they can work on a single task collaboratively. Training a large modern AI model on one GPU would take years; splitting the work across hundreds or thousands of GPUs, all synchronized, brings that down to weeks.
- DCGM (Data Center GPU Manager) is NVIDIA’s toolkit for monitoring GPU health, utilization, temperature, memory usage, and errors across a cluster — the equivalent of a dashboard that tells you whether every GPU in a fleet is actually being used efficiently or sitting idle/failing silently.
- InfiniBand and RDMA (Remote Direct Memory Access) are high-speed networking technologies that let GPUs on different servers exchange data directly, without going through the server’s CPU or operating system for every transfer. When a training job splits work across hundreds of GPUs, they need to constantly synchronize (an operation often called an “all-reduce”). If the network between them is slow, the GPUs sit idle waiting for data instead of computing — so the network fabric quality directly determines how much of that expensive GPU hardware is actually being used.
What is Slurm, and why do GPU clusters need a scheduler?
Once you have a cluster of, say, 500 GPUs shared across many teams and projects, a basic problem appears: who gets to use which GPUs, when, and for how long? Without a system to manage that, everyone would be fighting over the same hardware, jobs would collide, and expensive GPUs would sit idle while people waited their turn manually.
Slurm (Simple Linux Utility for Resource Management) is the workload manager built to solve exactly this problem. It originated in traditional supercomputing (HPC) environments — the kind of infrastructure used for climate simulation, physics research, and genomics — and has become one of the dominant schedulers for large AI training clusters as well, because the underlying problem (many users, a finite pool of extremely expensive specialized hardware, jobs that need exclusive or coordinated access) is the same one AI training faces.
How it works, in simple terms:
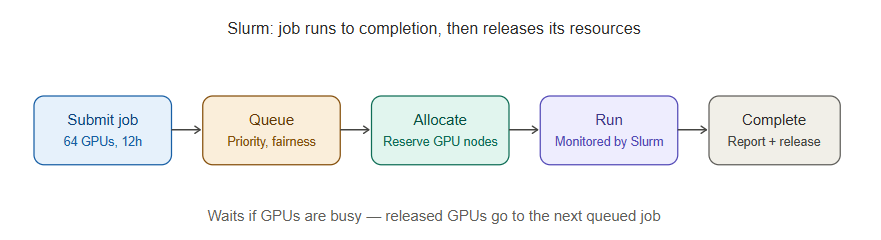
- A user submits a job — for example, “train this model using 64 GPUs for the next 12 hours.”
- Slurm looks at what’s currently running, what’s queued, and what priority each job has, and decides when and where that job runs across the cluster.
- Slurm manages partitions (logical groupings of nodes, e.g., a partition of GPU nodes vs. a partition of CPU-only nodes), queues (the order jobs will run in based on priority and fairness policies), and allocation (making sure a job gets exclusive access to the GPUs it was promised, without another job stepping on it).
- Once resources are free and the job’s turn comes up, Slurm launches it, monitors it while it runs, and reports back status, resource usage, and completion.
The reason Slurm remains dominant for large-scale AI training specifically is that training jobs are usually long-running, resource-intensive, and need tightly coordinated access to a fixed set of GPUs with high-performance networking between them for the whole duration of the job. Slurm was purpose-built for exactly that pattern.
What is Kubernetes, and how is it different from Slurm?
Kubernetes (often abbreviated K8s) is a container orchestration platform — a system for deploying, scaling, and managing applications that are packaged as containers (lightweight, portable units that bundle an application with everything it needs to run, using a technology like Docker).
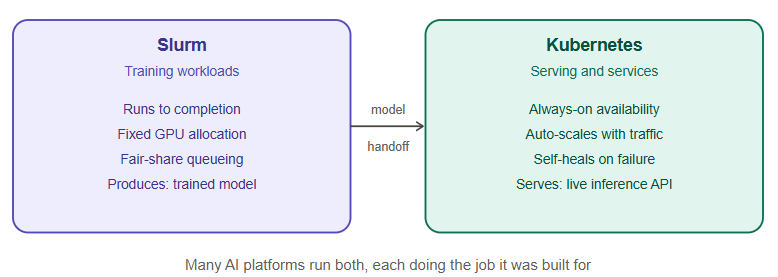
Where Slurm is built around the idea of “a job runs to completion and then finishes,” Kubernetes is built around the idea of “a service should keep running continuously, scale up and down with demand, and heal itself if something fails.” That difference in mindset is the key to understanding why AI infrastructure often uses both:
- Slurm’s world: training runs. You submit a job, it consumes a large chunk of GPU resources for a defined period, produces a trained model as output, and finishes.
- Kubernetes’ world: inference serving and supporting services. Once a model is trained, it needs to be served to users continuously — an API that answers requests 24/7, that can scale up when traffic increases and scale down when it doesn’t, and that Kubernetes will automatically restart if a container crashes. Kubernetes also runs the surrounding ecosystem: API gateways, monitoring dashboards, databases, and the web applications that sit on top of the AI model.
Some useful Kubernetes vocabulary:
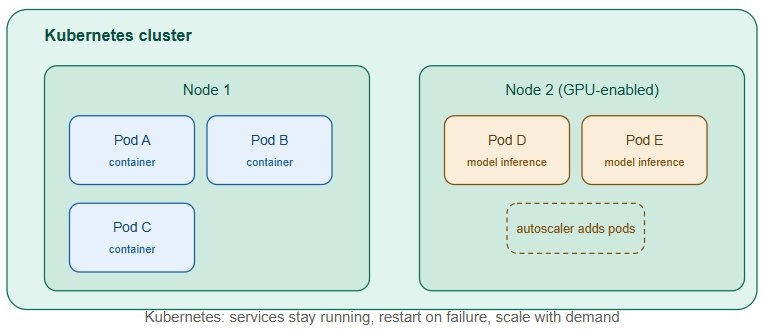
- A pod is the smallest deployable unit in Kubernetes — usually one container (or a small group of tightly coupled containers) running together.
- A node is a physical or virtual machine that runs pods. A Kubernetes cluster is a group of nodes managed together.
- The scheduler (yes, Kubernetes has its own scheduler too, conceptually similar in purpose to Slurm’s but designed for a different workload pattern) decides which node a given pod should run on, based on available resources.
- Autoscaling automatically adds or removes pods (or nodes) based on real-time demand — critical for AI inference workloads where traffic can spike unpredictably.
- GPU scheduling in Kubernetes is handled through device plugins (like the NVIDIA GPU device plugin) that let Kubernetes see GPUs as a schedulable resource, similar to how it schedules CPU and memory, so a pod can request “give me 1 GPU” the same way it requests “give me 2 CPU cores.”
Where the two overlap, and why modern AI platforms use both
It’s increasingly common for large AI infrastructure to run Slurm for training and Kubernetes for everything else — and in some environments, Kubernetes is even used to run Slurm itself as a managed service inside the cluster, or Slurm-on-Kubernetes hybrid schedulers are used to get the best of both models. The rough division of labor looks like this:
| Concern | Typically handled by |
|---|---|
| Large, long-running distributed training jobs across many GPUs | Slurm |
| Serving trained models as always-on APIs | Kubernetes |
| Auto-scaling inference based on user traffic | Kubernetes |
| Batch fine-tuning or experimentation jobs | Slurm (or Kubernetes-native job queues like Kubeflow) |
| Supporting services — monitoring, logging, gateways, databases | Kubernetes |
| Multi-tenant fair-share access to a fixed GPU pool for research teams | Slurm |
| Self-healing and automatic restarts of failed application components | Kubernetes |
The rest of the toolkit that ties it together
A handful of other tools consistently show up around GPUs, Slurm, and Kubernetes in a production AI platform, and it’s worth knowing what each does:
- Docker is the container technology itself — the format that packages an application and its dependencies so it runs identically anywhere. Kubernetes orchestrates containers; Docker (or alternatives like containerd) is what actually builds and runs them.
- MLflow and Kubeflow are MLOps (Machine Learning Operations) platforms that manage the lifecycle of a machine learning model — tracking experiments, versioning models, managing training pipelines, and often integrating directly with Kubernetes to run those pipelines at scale.
- Prometheus is a monitoring system that collects time-series metrics (CPU usage, memory, request latency, GPU utilization via DCGM exporters, and so on) from every component in the infrastructure.
- Grafana is the visualization layer that sits on top of Prometheus (and other data sources), turning raw metrics into dashboards a human can actually read at a glance — the difference between having the data and being able to use it during an incident.
- Ceph and Lustre are distributed storage systems built for exactly the kind of high-throughput, parallel access that GPU clusters need — many nodes reading and writing large datasets and checkpoints simultaneously without the storage becoming the bottleneck.
- Ansible and Terraform are automation and infrastructure-as-code tools: Terraform provisions infrastructure (spinning up servers, networks, storage) from a declarative configuration file, and Ansible automates configuration and repetitive operational tasks across many machines at once, both replacing manual, error-prone setup with repeatable, version-controlled processes.
Putting it all together: what a request actually experiences
To make the pieces concrete, here’s what happens end-to-end when an AI model is trained and then used, across this stack:
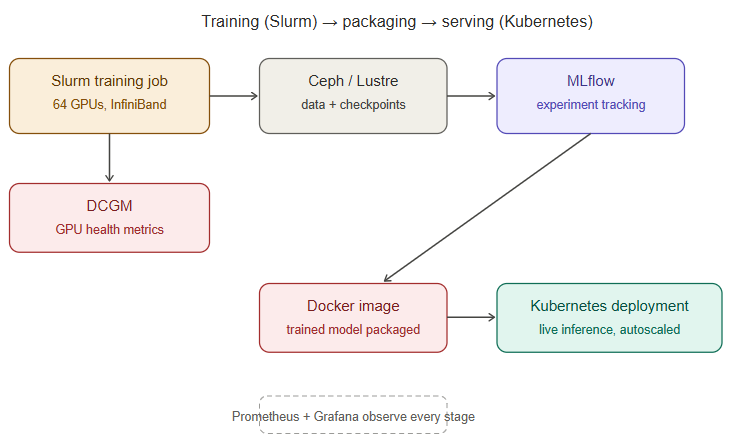
- Training: A data science team submits a Slurm job requesting 64 GPUs across 8 nodes, connected via InfiniBand for fast synchronization. Slurm queues the job, allocates the GPUs once they’re free, and launches the distributed training process. DCGM and Prometheus monitor GPU health and utilization throughout; Ceph or Lustre storage feeds training data in and writes model checkpoints out. MLflow tracks the experiment’s metrics and versions the resulting model.
- Deployment: The trained model is packaged into a Docker container and deployed onto a Kubernetes cluster as a pod, with the NVIDIA device plugin ensuring it gets GPU access for fast inference.
- Serving: A user sends a request to the AI application. Kubernetes routes it to an available pod running the model. If traffic spikes, Kubernetes’ autoscaler spins up additional pods (and, if needed, additional GPU nodes) to keep up.
- Observability: Prometheus continuously scrapes metrics from every layer — GPU utilization, pod health, request latency — and Grafana dashboards give the operations team a real-time view, so any degradation (a failing GPU, a saturated storage path, a network fabric issue) is visible before it becomes an outage.
- Automation underneath it all: Terraform provisioned the underlying compute, network, and storage infrastructure in the first place; Ansible keeps configuration consistent across every node in the cluster as it scales.
How this is actually managed in the real world: the vendor landscape
Everything above describes the concepts. In production, almost nobody builds every layer from raw open-source components by hand — most organizations buy or subscribe to a managed or packaged version of each layer, and the choice of vendor shapes how much operational burden the team actually carries. Here’s how the landscape breaks down in practice.
Managing Kubernetes
Running raw open-source Kubernetes yourself (often called “vanilla K8s”) is possible but operationally heavy — you own upgrades, control-plane availability, networking, and security patching. Most organizations instead use a managed or packaged distribution:
- Public cloud managed Kubernetes: AKS (Azure Kubernetes Service), EKS (Amazon Elastic Kubernetes Service), and GKE (Google Kubernetes Engine) are the three hyperscaler offerings. The cloud provider runs and patches the control plane; the customer manages worker nodes and workloads. These dominate when the AI platform lives natively in a public cloud.
- VMware Tanzu brings Kubernetes to VMware-virtualized private cloud and on-premises environments — relevant for sovereign or regulated environments that need Kubernetes running on top of an existing vSphere/NSX-T estate rather than a public cloud region. This is the common path for organizations that need Kubernetes but can’t or won’t run workloads outside their own data center.
- Red Hat OpenShift is an enterprise Kubernetes distribution with a heavier built-in tooling layer (CI/CD, developer console, integrated security policy) — popular in large regulated enterprises and government-adjacent deployments that want a supported, hardened distribution rather than assembling one from upstream components.
- Rancher (SUSE) is a Kubernetes management layer that sits across multiple clusters — including on-prem, edge, and multi-cloud clusters — giving one control plane to manage many, which matters once an organization has more than one Kubernetes cluster to keep consistent.
- Bare-metal / on-prem via kubeadm or Kubespray is still common in HPC-adjacent environments that want full control over the networking and hardware layer, especially where GPU nodes need specific driver, InfiniBand, and NUMA-topology tuning that a generic managed offering doesn’t expose.
The decision between these usually comes down to one question: does the AI workload run in a public cloud region, or does it have to stay inside a private/sovereign boundary? That single constraint eliminates AKS/EKS/GKE for a lot of sovereign AI programs and pushes them toward Tanzu, OpenShift, or a self-managed on-prem cluster instead.
Managing Slurm
Slurm itself is open source, maintained primarily by SchedMD, the company founded by Slurm’s original developers. In practice, very few large organizations run raw open-source Slurm without additional tooling around it:
- SchedMD offers commercial support, and its own Slurm Enterprise tooling, for organizations that want vendor backing on the core scheduler rather than relying purely on community support.
- NVIDIA Base Command Manager (formerly Bright Cluster Manager) is one of the most common ways GPU clusters are actually provisioned and operated end-to-end — it handles bare-metal provisioning, driver and CUDA installation, Slurm configuration, and monitoring as a single packaged product, and is a natural fit since it’s built by the same vendor supplying the GPUs.
- HPE Cray Programming Environment / HPE Performance Cluster Manager targets the traditional supercomputing space and is common where HPE supplies the underlying compute hardware.
- AWS ParallelCluster and Azure CycleCloud are the hyperscaler-native ways to stand up a Slurm cluster on cloud infrastructure — they automate provisioning cloud VMs/GPU instances, attaching storage, and configuring Slurm, without managing physical hardware.
- Run:ai and similar GPU-orchestration platforms sit above or alongside Slurm/Kubernetes to add fine-grained GPU fractioning, fair-share scheduling policies, and utilization analytics — increasingly used where GPU cost pressure makes maximizing utilization a first-class operational goal rather than an afterthought.
The common pattern: almost nobody hand-configures Slurm from source and manually manages every node. The GPU hardware vendor (NVIDIA via Base Command Manager) or the cloud provider (AWS/Azure) typically supplies the provisioning and lifecycle tooling, with Slurm as the scheduling engine underneath it.
The GPU hardware and cloud layer itself
- NVIDIA DGX / HGX systems are the reference hardware platforms most large GPU clusters are built from — pre-integrated servers with GPUs, high-speed interconnect, and validated firmware, sold either directly or through partners like Dell, HPE, Lenovo, and Supermicro who package the same NVIDIA reference designs into their own server lines.
- Hyperscaler GPU instances — Azure ND/NC-series, AWS P-series/Trainium, Google Cloud A3/TPU instances — are the cloud-native alternative for organizations that don’t want to own physical GPU hardware at all.
- Sovereign/private GPU cloud providers (regional players building dedicated GPU infrastructure for organizations that need data residency guarantees) have grown specifically to serve the sovereign AI use case — offering GPU capacity without workloads leaving a national or organizational boundary, which is the same constraint that shapes the Kubernetes vendor choice above.
Storage and networking vendors underneath it all
- Parallel/distributed storage: NetApp (particularly its AI-optimized storage lines), Pure Storage FlashBlade, VAST Data, WekaIO, and open-source Ceph or Lustre deployments are the common choices for storage that can keep up with hundreds of GPUs reading training data and writing checkpoints simultaneously.
- High-speed networking: NVIDIA Quantum InfiniBand switches (following NVIDIA’s acquisition of Mellanox) are the dominant InfiniBand fabric vendor; NVIDIA Spectrum Ethernet and other RDMA-over-Converged-Ethernet (RoCE) offerings are the Ethernet-based alternative for organizations standardizing on Ethernet instead of InfiniBand end to end.
Observability and MLOps vendors
- Prometheus and Grafana are usually run as open source directly, though managed variants exist (Grafana Cloud, Amazon Managed Service for Prometheus).
- NVIDIA DCGM is the standard for GPU-level telemetry regardless of which orchestration layer sits above it, and is typically wired into Prometheus via the DCGM exporter.
- MLflow is commonly self-hosted, though Databricks (which now maintains MLflow) offers it as a managed service; Kubeflow is almost always self-managed on top of an existing Kubernetes cluster, though Google Cloud Vertex AI Pipelines offers a managed equivalent for teams in GCP.
- Weights & Biases (W&B) is a common commercial alternative or complement to MLflow for experiment tracking, particularly popular in research-heavy teams.
The pattern across all of these choices
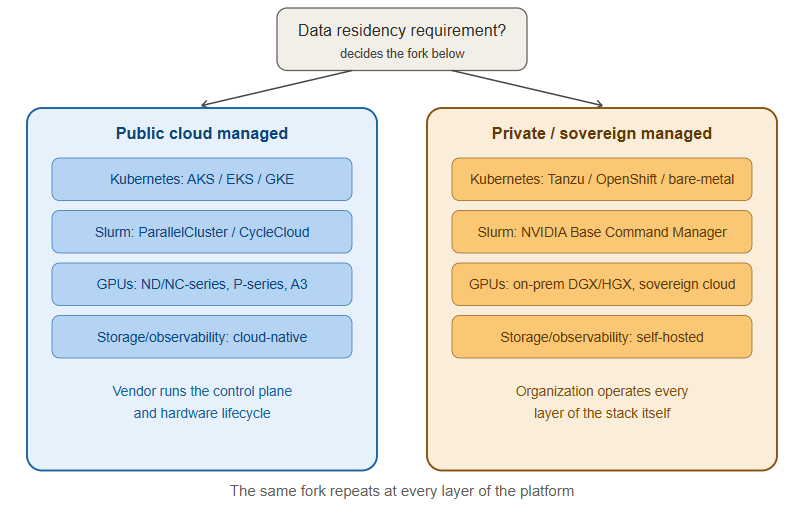
The vendor decision at every layer keeps coming back to the same fork: public-cloud-managed (AKS/EKS/GKE, ParallelCluster/CycleCloud, hyperscaler GPU instances) versus private/sovereign-managed (Tanzu/OpenShift/bare-metal Kubernetes, Base Command Manager/HPE cluster tooling, on-prem or sovereign GPU capacity, self-hosted storage and observability). Organizations with strict data residency, national sovereignty, or regulatory requirements consistently land on the second path across every layer of the stack — which is exactly why a “sovereign AI” program ends up needing engineers who are comfortable operating the full stack themselves rather than consuming it as a managed service, and it’s the throughline connecting every vendor choice described above.
What Data scientist handsoff to Slurm Operator
1. Physical and facility layer (data center team owns, hands off as “ready racks”)
- Power — provisioned circuits sized for GPU server draw (a single 8-GPU DGX-class node can pull 10kW+; multiply by hundreds of nodes)
- Cooling — liquid cooling loops or high-density air cooling validated for the GPU rack density (GPU racks run far hotter per rack-unit than typical compute)
- Rack and cabling — physical racking of GPU servers, InfiniBand/Ethernet cabling done and cable-tested (a single bad IB cable can silently degrade an all-reduce across the whole job)
- Physical security and access control for the racks
2. Bare-metal compute (handed off as “provisioned nodes”)
- Servers with GPUs installed, firmware/BIOS baselined, and burned in (stress-tested for 24–72 hours to catch DOA GPUs, memory errors, or thermal issues before they become a training job’s problem)
- Base OS image (usually a specific validated Linux distro/kernel version — GPU driver and InfiniBand driver compatibility is version-sensitive, so this isn’t just “install Ubuntu”)
- NVIDIA driver + CUDA toolkit + NCCL (the library that actually does the GPU-to-GPU communication) pre-installed and validated
- Node health-check baseline (DCGM diagnostics run and passed) before the node is considered “ready”
3. Network fabric (handed off as “fabric is live and validated”)
- InfiniBand or RoCE fabric physically built, switches configured, and fabric performance validated — this usually means running a benchmark (like
ib_write_bwor NCCL tests) across the fabric before declaring it production-ready, not just checking link lights - IP/management network for out-of-band access (IPMI/iLO/BMC) so the ops team can power-cycle or diagnose a node without physically walking to it
- Topology documentation — which nodes sit on which leaf switch matters a lot for how Slurm should be told to place jobs (you want GPUs working together to be as topologically close as possible)
4. Storage (handed off as “mounted and benchmarked”)
- Parallel filesystem (Lustre/Ceph/WekaIO/etc.) deployed, mounted on every compute node, and throughput-tested against the expected concurrent read pattern of a real training job — not just “it mounts,” but “it can sustain X GB/s with 500 nodes hammering it at once”
- Separate tiers are common: a fast scratch/checkpoint tier and a slower bulk-dataset tier
5. What the Slurm/HPC team then builds on top
Once that foundation is handed off, the Slurm team’s job starts:
- Install and configure Slurm itself — partitions, QOS policies, fair-share accounting, job accounting database (
slurmdbd) - Configure topology-aware scheduling so Slurm knows the network layout from step 3 and can pack jobs onto physically close nodes
- Set up GRES (Generic Resource) definitions so Slurm can schedule GPUs as a first-class resource
- Layer in monitoring (Prometheus/Grafana/DCGM exporters) tied to Slurm job IDs, so a slow job can be traced back to a specific node or GPU
- Build the container/environment tooling (usually Pyxis + Enroot, or Singularity/Apptainer) so users can run their PyTorch/training containers as Slurm jobs
- Set up the actual LLM training environment on top: framework (PyTorch + DeepSpeed/Megatron-LM/NeMo), distributed launcher scripts, checkpointing pipeline to the storage tier
So in short: the data center hands off validated, benchmarked, burned-in infrastructure — compute, fabric, storage, all proven to perform at the numbers promised — and the Slurm/HPC team turns that into a schedulable, multi-tenant training platform that a data science team can actually submit an LLM training job to.
Why this matters
None of these technologies exist in isolation, and none of them is sufficient on its own. A GPU without a scheduler is idle expensive hardware fought over manually. A scheduler without observability is a black box you can’t debug when something goes wrong. A trained model without an orchestration layer to serve it is a file sitting on a disk, not a product. Understanding each piece — what problem it solves and where its boundaries are — is what makes it possible to reason about the system as a whole instead of treating it as a stack of buzzwords, and it’s the foundation for operating, troubleshooting, and scaling any real AI infrastructure platform.
Choosing the Right Networking Solution is Essential for AI Success
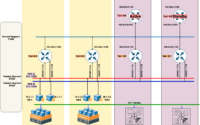
NSX-T Series: Part 16 – NSX-T Segment T1 Gateway with EDGE Cluster(SR)
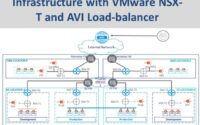
VMware Design Bootcamp-4: NSX-T and AVI Load-balancer
About Author
abhishek
Expert in Network, Virtualization and Security field in On-Prem and Public Cloud. Passionate about new technology and consult the best solution to business organisation.Previously served Networkershome, EMC2, Cisco, VMware and Arista in different fields of Engineering, TAC, Consulting, Designing and Training. Certification : CCIE#48639, VCIX DCV and NV, Aviatrix Multi Cloud, SD-WAN Specialist, Palo Alto PCNSE, Amazon Cloud, Docker Certified Engineer. LinkedIn : https://www.linkedin.com/in/abhishekkunal51/