Kubernetes for AI/ML Workloads: Scheduling, MLOps Integration, and Day-2 Operations at GPU Scale
Kubernetes was designed around a simple assumption: workloads are interchangeable, resources are fungible, and any pod can move to any node without much consequence. AI/ML training and inference break every part of that assumption. GPUs aren’t interchangeable — a workload that needs eight GPUs on the same NVLink domain fails just as hard on the wrong eight GPUs as it does on zero. A single distributed training job can span dozens of pods that all have to start together or not at all. And the “workload” itself is no longer just a container — it’s a training pipeline with an experiment tracker, an artifact store, and a scheduler-of-schedulers sitting on top of Kubernetes’ own scheduler.
This post walks through the operational patterns that show up once Kubernetes starts running real AI/ML infrastructure: how GPU scheduling actually works under the hood, how Kubeflow and MLflow plug into that scheduling layer, how multiple teams share a GPU pool without starving each other, and the day-2 realities of troubleshooting and upgrading a cluster that can’t afford to lose a week-long training run.
1. Scheduling GPU Workloads
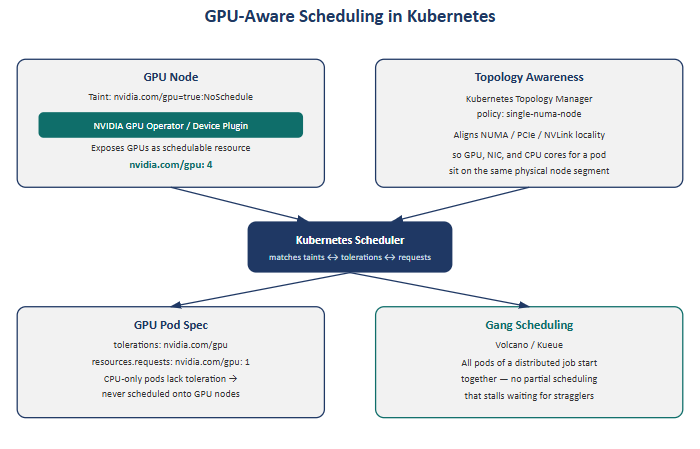
Kubernetes has no native concept of a GPU. Everything starts with making GPUs visible to the scheduler at all, then making sure the scheduler places workloads intelligently rather than just “somewhere with a free GPU.”
Making GPUs schedulable. The NVIDIA GPU device plugin — or more commonly today, the full NVIDIA GPU Operator — runs on every GPU node and exposes nvidia.com/gpu as a schedulable resource, the same way cpu and memory are built in. Without this, a GPU node’s accelerators are invisible to the scheduler entirely; pods can land on the node and simply never see a GPU.
Keeping non-GPU workloads off GPU nodes. GPU nodes are tainted (nvidia.com/gpu=true:NoSchedule), and only pods that explicitly request GPU resources carry the matching toleration. This is what stops a routine CPU-only service from accidentally consuming a node that cost ten times as much as a standard compute node.
Topology-aware placement. Requesting “a GPU” isn’t enough at scale — a multi-GPU pod needs its GPUs, NICs, and CPU cores aligned on the same NUMA node and PCIe topology, or performance quietly collapses due to cross-socket traffic. This is handled either through the GPU Operator’s topology manager integration or Kubernetes’ native Topology Manager running the single-numa-node policy, which refuses to place a pod at all rather than place it with a bad topology.
Gang scheduling for distributed jobs. The default Kubernetes scheduler places pods independently and greedily — it has no idea that four pods belong to the same distributed training job and need to start simultaneously. Partial scheduling (two pods running, two stuck pending) means the two running pods sit idle waiting for peers that may never arrive, burning expensive GPU time. Tools like Volcano and Kueue add gang scheduling on top of the default scheduler so that all pods in a job are scheduled together as a single unit, or not at all.
2. Integrating Kubeflow and MLflow with the Underlying GPU Infrastructure
Kubeflow and MLflow solve different problems, and it’s worth being precise about where each one sits.
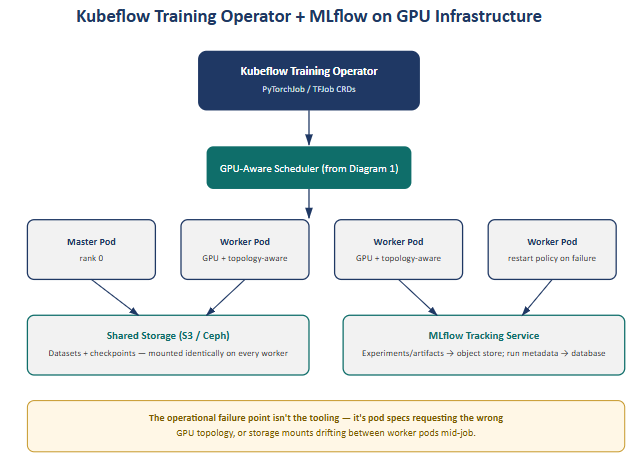
Kubeflow’s Training Operator (via the PyTorchJob and TFJob custom resources) handles distributed job orchestration on top of the GPU-aware scheduler described above. It’s the layer that turns “train this model across 8 GPUs” into the right set of master/worker pods, with the correct restart policies if a worker dies mid-job.
MLflow operates independently of the scheduling problem entirely — it tracks experiments, parameters, and artifacts, typically running as an in-cluster service backed by object storage (S3 or Ceph) for artifacts and a relational database for run metadata.
The two systems only become an operational concern where they touch the infrastructure layer underneath them. There are two failure points worth knowing cold:
- Pod spec correctness. If the Training Operator’s generated pod specs don’t request GPU resources and topology hints correctly, jobs either fail to schedule or land with poor GPU locality — the orchestration layer is only as good as what it hands to the scheduler.
- Storage consistency. Datasets and checkpoints need to be mounted identically across every worker pod. A shared volume that’s mounted with different paths, permissions, or staleness on even one worker silently corrupts a distributed training run — one of the more painful classes of bug because it doesn’t fail loudly, it just produces bad results.
3. Multi-Tenancy and Resource Quotas
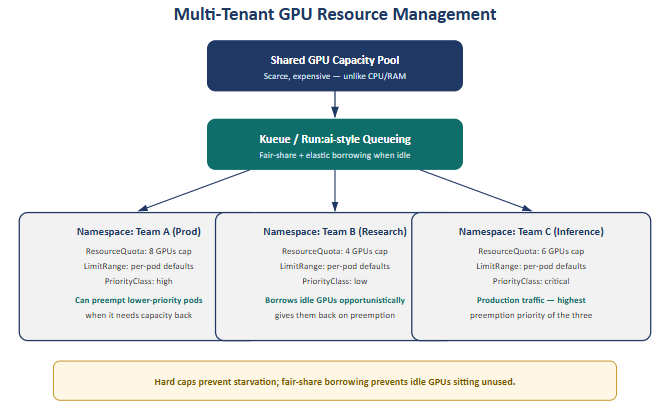
GPUs are scarce and expensive in a way CPU and memory generally aren’t, which means the “one team starves another” failure mode is far more costly on a GPU cluster than a general-purpose one.
The baseline pattern is one namespace per team or project, with ResourceQuota capping total GPU consumption per namespace and LimitRange setting sane per-pod defaults so a single misconfigured job can’t silently claim the entire quota. PriorityClass layered on top lets production workloads preempt lower-priority research or experimentation pods when capacity is tight.
Raw quotas alone are a blunt instrument — a team’s unused quota just sits idle rather than being available to anyone else. Kueue, or commercial equivalents like Run:ai, add fair-share scheduling and elastic borrowing on top of hard quotas: idle capacity can be borrowed by other teams, but hard caps snap back into effect the moment the owning team needs their capacity again. This borrow-and-reclaim model is what makes multi-tenant GPU clusters efficient instead of just safe.
4. Troubleshooting a Kubernetes GPU Scheduling or Networking Incident
A useful mental framework for “why is my pod stuck” on a GPU cluster:
| Symptom | First check | What it tells you |
|---|---|---|
Pod stuck Pending | kubectl describe pod — scheduling events | Insufficient GPU resources, taint/toleration mismatch, or topology constraint that can’t be satisfied |
| Nodes under pressure | kubectl top nodes | Memory/CPU exhaustion masquerading as a scheduling failure |
| Cluster-wide weirdness | kubectl get events --all-namespaces | CNI errors, image pull failures, or node-level problems not visible from a single pod’s perspective |
| RDMA/InfiniBand pods failing to get network | CNI daemonset logs + host NIC state | Common with SR-IOV-based CNIs (Multus + SR-IOV CNI) used to expose InfiniBand interfaces into pods — the failure often lives at the host network layer, not in Kubernetes at all |
The step that’s easy to skip under pressure: once the immediate issue is resolved, add monitoring or alerting for that specific failure signature so the same class of problem pages the team before users notice, rather than being rediscovered from scratch next time.
5. Upgrading a Production AI/ML Kubernetes Cluster with Minimal Downtime
Upgrading a cluster that’s mid-training-run has different stakes than upgrading a stateless web service fleet — you can’t just reschedule a job that’s four days into a two-week run.
Control plane first. With an HA control plane, upgrading it has no workload impact — this is the safe, low-stakes part of the process.
Worker nodes in rolling batches, following cordon → drain (respecting PodDisruptionBudgets) → upgrade or replace → uncordon. This is standard practice for stateless workloads.
GPU nodes need an extra layer of care. A long-running training job shouldn’t be hard-evicted mid-checkpoint — draining needs to be coordinated with the training job’s own checkpointing cadence, so a node upgrade waits for (or triggers) a checkpoint rather than losing however many hours of progress sat in GPU memory.
Stage it in non-production first. The most common real-world failure point isn’t Kubernetes itself — it’s a GPU Operator version that hasn’t been validated against the new Kubernetes/containerd version, which shows up as driver or device-plugin breakage across the entire GPU fleet at once. Catching that in a staging cluster is considerably cheaper than catching it in production.
6. The GPU/HPC-Focused Kubernetes Operator Ecosystem
A short list of the operators that consistently show up once a cluster is running real GPU workloads at scale:
- NVIDIA GPU Operator — automates the full lifecycle of drivers, the CUDA toolkit, the device plugin, and the DCGM exporter across every GPU node. At any meaningful scale, manually installing and versioning GPU drivers per node stops being viable; this is what makes fleet-wide GPU management tractable.
- Volcano and Kueue — add the HPC-style gang scheduling and fair-share queueing that the vanilla Kubernetes scheduler was never designed for, covered in sections 1 and 3 above.
Together, these operators are what let a general-purpose orchestrator like Kubernetes behave like a purpose-built HPC scheduler when it needs to — without giving up everything else Kubernetes is good at for the rest of the platform.
Where the Pieces Fit Together
Stepping back, the six areas above aren’t independent — they’re layers of the same stack:
- Section 1 (scheduling) is the foundation everything else sits on
- Section 2 (Kubeflow/MLflow) is the MLOps layer that consumes that scheduling foundation
- Section 3 (multi-tenancy) is the governance layer that decides who gets access to it
- Sections 4–5 (incident response, upgrades) are the day-2 operational disciplines that keep it running
- Section 6 (the operator ecosystem) is what makes all of the above maintainable at fleet scale rather than as a collection of manual, per-node procedures
Get the scheduling layer wrong, and nothing above it works reliably no matter how well-configured Kubeflow or MLflow are. Get the governance layer wrong, and a well-scheduled cluster still turns into a source of team conflict over capacity. The operational maturity of an AI/ML platform shows up less in any single piece of tooling and more in how cleanly these layers hand off to each other.
For organizations looking to bridge the gap between development and production, Trezbon Professional Services offers end-to-end expertise to design, deploy, and secure your high-performance environment; whether you need help with foundational infrastructure, advanced AI networking, or robust cybersecurity, reach out to trezbon.com/services to accelerate your deployment.
NVIDIA GPU Workloads on Kubernetes — Part 2: Installing the GPU & Network Operators
GPUs, Slurm, and Kubernetes: The Building Blocks of Modern HPC and AI Infrastructure
Building the Backend: AI Fabric Design from Scalable Units to Lossless RoCEv2
About Author

abhishek
Expert in Network, Virtualization and Security field in On-Prem and Public Cloud. Passionate about new technology and consult the best solution to business organisation.Previously served Networkershome, EMC2, Cisco, VMware and Arista in different fields of Engineering, TAC, Consulting, Designing and Training. Certification : CCIE#48639, VCIX DCV and NV, Aviatrix Multi Cloud, SD-WAN Specialist, Palo Alto PCNSE, Amazon Cloud, Docker Certified Engineer. LinkedIn : https://www.linkedin.com/in/abhishekkunal51/