What a Slurm Admin Actually Does, Day to Day
The muscle-memory layer: commands, config files, and scripts — for the networking person moving into HPC/AI Ops
(Part two of a series — part one: From Jupyter Notebook to InfiniBand Fabric, covering what the ML/LLM team actually hands you before this stage begins.)
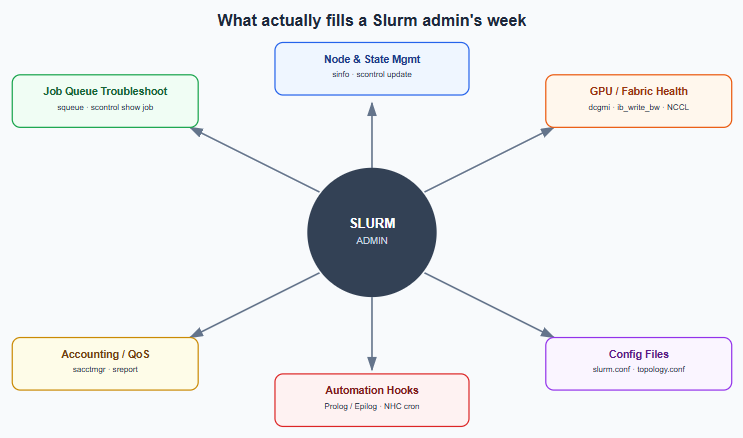
Knowing what Slurm is and knowing what a Slurm admin does all week are two different kinds of knowledge. The first is conceptual — a scheduler allocates resources, jobs run, containers pull GPUs over a fabric. The second is muscle memory: the specific commands you reach for when a job won’t start, the config file you edit when a multi-node job lands on the wrong switches, the cron job that quietly saves you from a 2am page.
This is the muscle-memory layer — organized the way the job actually gets done, not the way a manual would present it.
1. Cluster & Node State Management
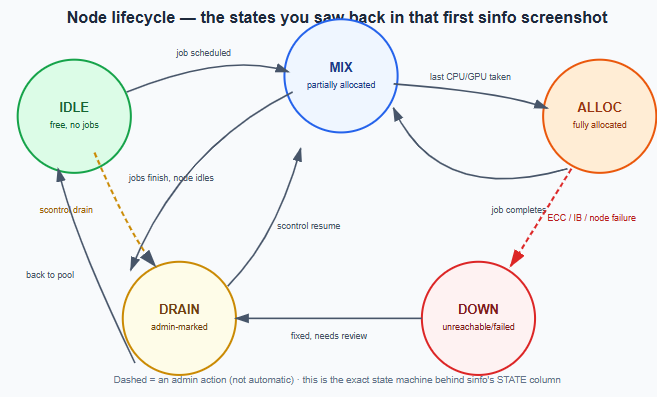
If you’ve ever run sinfo -p defq and seen a node sitting in drain, mix, or alloc, you’ve already seen the exact state machine you’ll be driving daily. These aren’t just status labels — they’re a real lifecycle, and as the admin you’re often the one triggering the transitions manually.
# Check overall cluster health
sinfo -N -l
sinfo -p defq -o "%20N %10T %10c %10m %25f %G"   # custom output with GRES (GPUs)

# Drain a node — stop new jobs, let running ones finish
scontrol update nodename=comp045 state=drain reason="GPU ECC errors - ticket INC123456"

# Bring it back after maintenance
scontrol update nodename=comp045 state=resume

# Mark a node down immediately (kills running jobs — use carefully)
scontrol update nodename=comp045 state=down reason="NVLink failure"

# Inspect a node in full detail — GRES, features, current jobs
scontrol show node comp045
This is the direct equivalent of draining a BGP neighbor or shutting a port before maintenance — same philosophy, different layer of the stack.
2. Job Queue Management & Troubleshooting
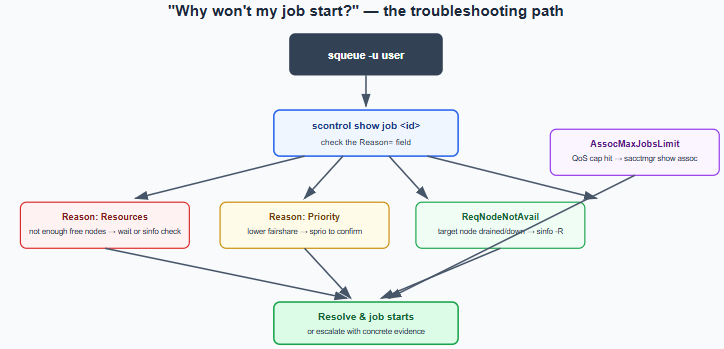
The single most common support request an admin gets is some version of “my job won’t start.” It always resolves through the same path, and scontrol show job is where you’ll spend most of your actual debugging time.
squeue                               # what's running/pending right now
squeue -u username                   # a specific user's jobs
squeue --start                       # estimated start times for pending jobs
squeue -p defq -t PENDING            # why is the queue backed up?

scontrol show job 482913             # full detail on one job — your #1 debugging tool

scancel 482913                       # kill a specific job
scancel -u username                  # kill all of a user's jobs
scancel --state=PENDING -p defq      # clear a stuck queue

sacct -j 482913 --format=JobID,State,ExitCode,Elapsed,MaxRSS,NodeList
sacct -u username --starttime=2026-07-01 --format=JobID,JobName,Partition,State,ExitCode
The Reason= field inside scontrol show job is the whole game — it tells you why something is pending (Resources, Priority, ReqNodeNotAvail, AssocMaxJobsLimit), and each reason maps to a different, specific fix.
3. Accounting, Fairshare, and QoS
This is the policy layer — the part that decides which team’s job jumps the queue when GPUs are scarce. Conceptually it’s the same job a QoS/CoS marking does on a network, except the currency being managed is GPU-hours instead of bandwidth.
bash
sacctmgr show associations           # who can run where, at what priority
sacctmgr add account mlteam Description="LLM Pretraining" Organization="ADNOC"
sacctmgr add user jdoe Account=mlteam
sacctmgr modify qos gpu_high set MaxTRESPerUser=gres/gpu=32

sreport cluster AccountUtilizationByUser start=2026-06-01 end=2026-06-30
sreport user TopUsage start=2026-06-01
4. Config Files You’ll Actually Edit
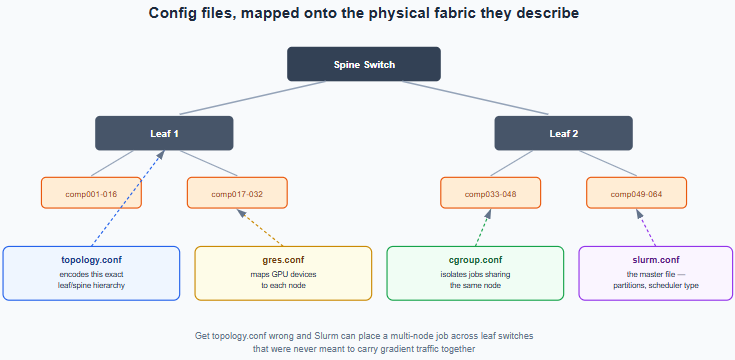
slurm.conf— the master config: partitions, node definitions, scheduler type (SchedulerType=sched/backfillis standard),SelectType=select/cons_tres(required for GPU-aware scheduling).gres.conf— maps GPUs to nodes:Name=gpu Type=h100 File=/dev/nvidia0 Cores=0-15.topology.conf— describes the actual switch/fabric hierarchy so Slurm can place multi-node jobs on topologically close nodes instead of scattering them across leaf switches:
  SwitchName=leaf1 Nodes=comp[001-016]
  SwitchName=leaf2 Nodes=comp[017-032]
  SwitchName=spine1 Switches=leaf1,leaf2
This one is squarely networking territory — it’s literally your fabric diagram, encoded as scheduler policy.
cgroup.conf— enforces resource isolation (CPU/memory/GPU limits per job) so jobs sharing a node can’t step on each other.
After any edit: scontrol reconfigure hot-reloads without restarting slurmctld, most of the time.
5. GPU & Fabric Health Checks
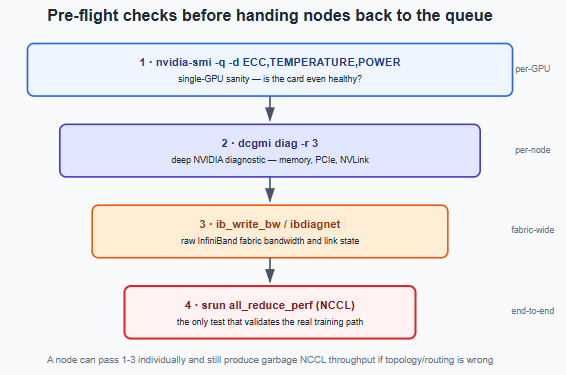
This is the actual daily grind on an AI cluster — the pre-flight sequence run before releasing nodes back to the queue after maintenance, or before handing nodes to a big training job. Each stage catches something the previous one physically can’t.
bash
# Single-GPU sanity
nvidia-smi -q -d ECC,TEMPERATURE,POWER

# Deeper NVIDIA diagnostic — memory, PCIe, NVLink
dcgmi diag -r 3
dcgmi health -c

# Fabric-level sanity
ib_write_bw -d mlx5_0                          # raw InfiniBand bandwidth test
ibstat                                          # port state, link speed
ibdiagnet                                       # fabric-wide diagnostic scan

# The test that actually matters — validates the real training path end-to-end
srun -N2 --gres=gpu:8 all_reduce_perf -b 8 -e 1G -f 2 -g 8
A node can pass every check up through ibstat individually and still produce garbage NCCL throughput if the topology or routing underneath is wrong. That last test is the only one that proves the whole path actually works.
6. Prolog/Epilog Scripts — the Automation Layer Admins Actually Write
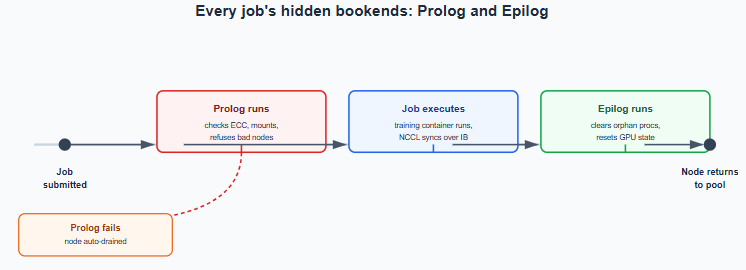
Slurm lets you hook a script before (Prolog) and after (Epilog) every job, defined in slurm.conf. This is where “job ran but silently degraded” gets caught proactively, instead of after a training team complains their throughput tanked for three days.
# /etc/slurm/prolog.sh — runs before every job on the node
#!/bin/bash
nvidia-smi --query-gpu=index,ecc.errors.uncorrected.volatile.total --format=csv,noheader \
  | awk -F',' '$2 > 0 {exit 1}'   # refuse to start the job if a GPU has uncorrected ECC errors
# /etc/slurm/epilog.sh — runs after every job, cleans up
#!/bin/bash
# clear any orphaned GPU processes, reset MPS if used
nvidia-smi --gpu-reset 2>/dev/null || true
7. Recurring Cron/Automation Scripts
- A node health-check cron, often built on NHC (Node Health Check) — a widely used open-source tool that periodically runs
nvidia-smi, checks disk space, checks IB link state, and auto-drains a node if something fails. It’s the exact same watchdog pattern behind any self-built monitoring dashboard for a recurring infra issue — write it once, let it catch problems before a human has to. - A munge key sync check — Slurm auth depends on
mungehaving an identical key across every node; a silent munge failure looks like random “job submission failed” errors cluster-wide, so admins script a periodic checksum comparison across nodes. - Log rotation/monitoring for
slurmctld.logandslurmd.log, typically shipped into the same Prometheus/Grafana stack already scraping DCGM metrics.
8. Monitoring: Prometheus + Grafana
Everything above this line is what you do when something’s already wrong. This section is what tells you something’s wrong in the first place — the same shape as any NMS pipeline you’ve already built: counters exported, scraped centrally, visualized, and alerted on.
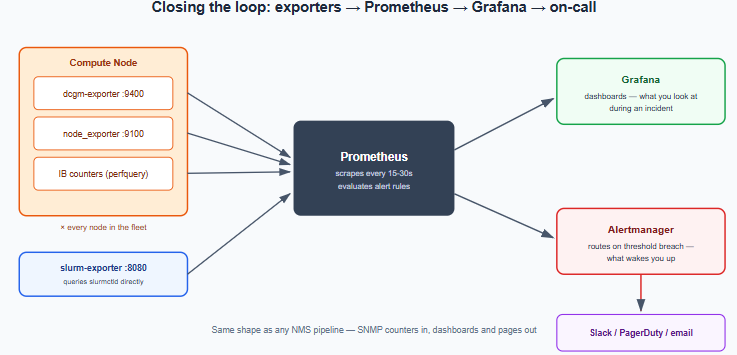
The exporters actually running on every node:
dcgm-exporter— NVIDIA’s own exporter, wraps DCGM to expose GPU utilization, temperature, power draw, ECC error counts, and NVLink/PCIe throughput as Prometheus metrics on:9400.node_exporter— the standard Prometheus exporter for CPU, memory, disk, and general host health.slurm-exporter— a community exporter that queriesslurmctlddirectly and exposes queue depth, job counts, and node-state counts (idle/mix/alloc/drain/down) as metrics — this is what turns thatsinfooutput into a time series you can graph and alert on.- IB fabric counters — pulled via
perfqueryor a custom exporter wrapping it, exposing port error/drop counters per switch port.
A minimal scrape config (prometheus.yml):
scrape_configs:
  - job_name: 'dcgm'
    static_configs:
      - targets: ['comp001:9400', 'comp002:9400']   # generated from the node list in practice
  - job_name: 'node'
    static_configs:
      - targets: ['comp001:9100', 'comp002:9100']
  - job_name: 'slurm'
    static_configs:
      - targets: ['slurmctld-host:8080']
PromQL queries you'll actually write:
promql# average GPU utilization per node, last 5 minutes
avg by (instance) (DCGM_FI_DEV_GPU_UTIL)
# any GPU reporting an uncorrectable ECC error
DCGM_FI_DEV_ECC_DBE_VOL_TOTAL > 0
# InfiniBand port error rate
rate(infiniband_port_errors_total[5m]) > 0
# how many nodes are currently in each Slurm state
count by (state) (slurm_node_state)
Alerting rules — this is where monitoring stops being a dashboard you glance at and starts being the thing that pages you before a user notices:
yamlgroups:
- name: gpu-fabric
rules:
- alert: GPUUncorrectableECC
expr: DCGM_FI_DEV_ECC_DBE_VOL_TOTAL > 0
for: 1m
labels:
severity: page
annotations:
summary: "Uncorrectable ECC error on {{ $labels.instance }}"
- alert: IBPortErrorRateHigh
expr: rate(infiniband_port_errors_total[5m]) > 10
for: 5m
labels:
severity: warn
annotations:
summary: "Rising IB error rate on {{ $labels.instance }}"
What the Grafana dashboard actually looks like — the panels that matter enough to earn permanent screen real estate: a per-node GPU utilization heatmap (dead giveaway for idle GPUs burning allocation), temperature/power trend lines, IB port error/drop counters, Slurm queue depth by partition, a live node-state summary (the graphed version of that original sinfo output), fairshare usage by account, and an active-alerts panel pinned at the bottom so nothing scrolls out of view during an incident.
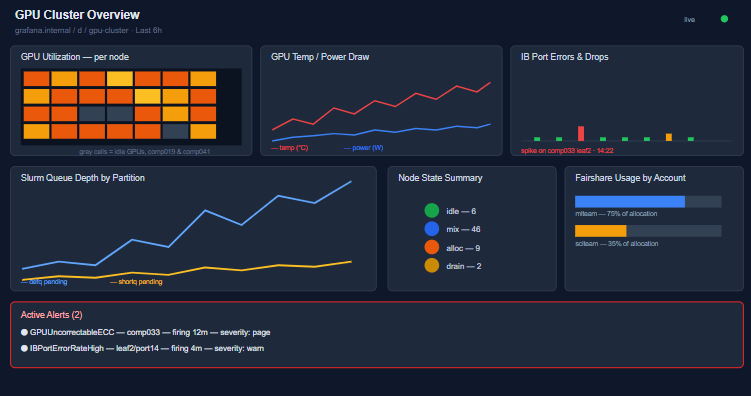
The node-state panel is worth pausing on — it’s the same idle/mix/alloc/drain/down breakdown from the very first sinfo -p defq in this series, just graphed over time instead of read as a snapshot. That’s the real value monitoring adds: the terminal tells you the state right now; Grafana tells you whether it’s been trending toward a problem for the last six hours.
Where the Week Actually Goes
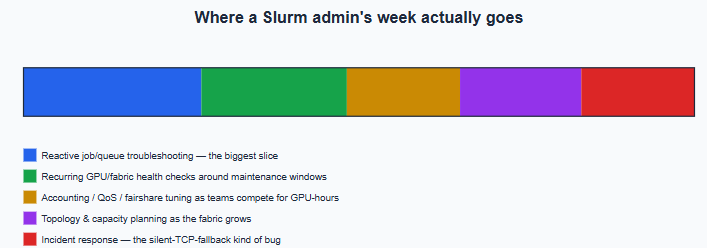
| Time spent | Task |
|---|---|
| Reactive | Debugging stuck/pending jobs (scontrol show job), draining bad nodes |
| Recurring | Health checks before/after maintenance windows, fabric diagnostics |
| Policy | Adjusting QoS/fairshare as teams compete for GPU-hours |
| Planning | topology.conf updates as the fabric grows, partition redesigns |
| Incident | Multi-node jobs silently falling back to TCP, chased down via NCCL_DEBUG=INFO |
Why This Layer Is the Real Job
None of this shows up in the ML team’s documentation, because it isn’t their layer — it’s yours. The conceptual picture of “Slurm schedules jobs” is true but useless on its own; the actual job is knowing which command answers which question in under thirty seconds, which config file encodes which piece of physical reality, and which script quietly prevents the incident that would otherwise eat your afternoon.
Designing and implementing the seamless ML-to-HPC transition highlighted here requires specialized expertise; for help with infrastructure design, advanced AI networking, and robust cybersecurity in your HPC environment, reach out to Trezbon Professional Services attrezbon.com/services.
If you are looking for additional services like SEO optimization, technical writing, or strategic consulting, visit trezbon.com/services to learn how we can help your business.

VeloCloud Licensing, Support & BOQ: Complete SD-WAN Guide

From Certification to Production: What the Aviatrix ACE Teaches About Multicloud Transit
Azure Has Lost the Plot: When Feature Marketing Replaces the Promise of Easy Cloud
About Author

abhishek
Cloud Platform Lead and AI Infrastructure Architect at e& enterprise, with 12+ years in data center, virtualization, security and AI infrastructure. I design and build private cloud and sovereign AI platforms, working with VMware (NSX-T, vSphere, vSAN, HCX, AVS, SRM), Kubernetes, Terraform and GPU inference infrastructure for LLMs. Previously served Networkers Home (CCIE instructor, trained around 50 CCIEs), VCE/EMC2, Cisco, VMware and Arista across TAC, consulting, design and training. Certifications: CCIE#48639 (Data Center and R&S), VCIX-DCV and NV, CKA, NVIDIA AI Infrastructure, Azure Solutions Architect Expert, Terraform Associate, Palo Alto PCNSE. LinkedIn: https://www.linkedin.com/in/abhishekkunal51/