vLLM in 2026: An Infrastructure Engineer’s Field Guide
A six-part series for the people who have to make LLM serving actually run: on real GPUs, over real fabrics, at a real cost.
Why this series exists
Most vLLM content is written by and for ML engineers: model quality, sampling parameters, prompt tricks. But if you run the platform underneath, the questions you get are different:
- Why did p99 latency triple when the agent workload arrived?
- Why is one expert-parallel rank at 100% and the rest idle?
- Can we run this on AMD, TPU, or Gaudi, or are we locked in?
- How much of our fabric budget goes to KV cache transfers?
- What does “just quantize it” really cost in quality?
The vLLM ecosystem has grown from a single fast inference engine into a full serving stack with multiple hardware backends, disaggregated serving, agent-aware routing, quantization pipelines, and a tight loop with RL training. This series walks through that stack with one lens: where do tokens get computed, how does state move, and what does it cost?
The three questions
Every topic in the series maps to one of these:
| Question | What it covers | Posts |
|---|---|---|
| Where does compute happen? | Engine internals, hardware backends, parallelism | 1, 2, 3 |
| How does state move? | KV cache, weights, activations across GPUs and nodes | 3, 4, 6 |
| What does it cost? | Quantization, caching, speculative decoding, utilization | 4, 5, 6 |
The series
- Inside the Engine: PagedAttention, the scheduler, model loading, and how
torch.compilefits in. - One API, Four Silicon Families: NVIDIA, AMD, Google TPU, and Intel behind the same
vllm serve. - Distributed Inference Is a Network Problem: TP, PP, DP, EP, prefill/decode disaggregation, and llm-d.
- Agentic Workloads Break Your Capacity Model: long contexts, prefix caching, KV offload, and the right metrics.
- Compression Without Regret: PTQ vs QAT, FP8/INT4/FP4, and how to evaluate before you ship.
- Where Training Meets Serving: RL rollouts with vLLM and speculative decoding draft training.
Every post ends with a short checklist you can take into a design review.
A note on versions
vLLM moves quickly. Flags, defaults, and metric names change between releases. Every command in this series is meant to illustrate a concept; check it against the docs for the version you run before you paste it into production.
Inside the Engine: What vLLM Actually Does with Your Request
Part 1 of “vLLM in 2026: An Infrastructure Engineer’s Field Guide”
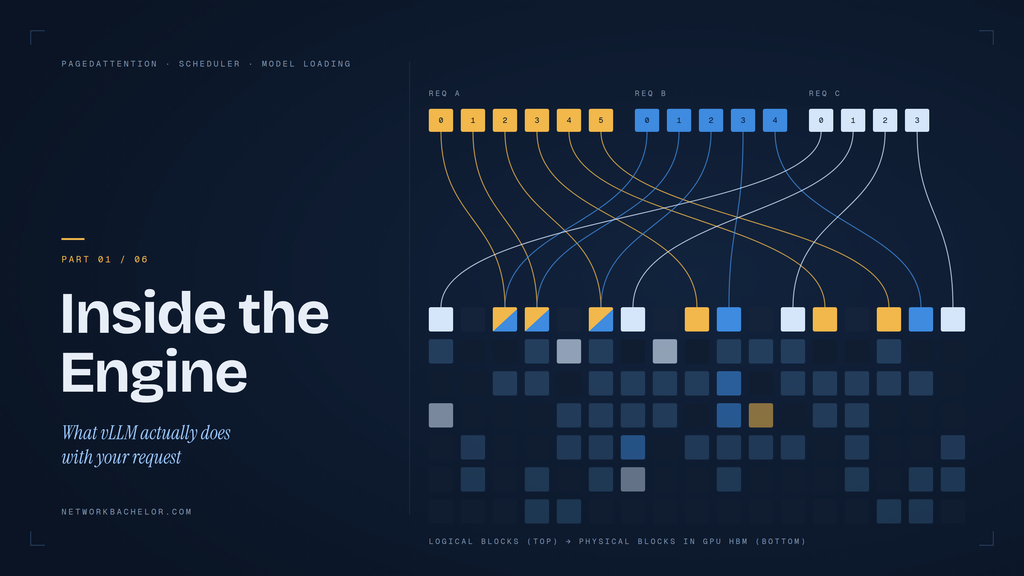
If you operate an LLM platform, you don’t need to write attention kernels. But you do need a mental model of what happens between POST /v1/chat/completions and the first token, because almost every production problem (OOM, latency spikes, slow cold starts) traces back to one of a handful of engine mechanisms.
This post covers those mechanisms: the memory model, the scheduler, how a checkpoint becomes a running model, and how PyTorch’s compiler stack fits in.
[Add from talk: “State of vLLM 2026”, “PyTorch <3 vLLM”, “How a Transformers Model Loads in vLLM”: headline roadmap items, project stats, new defaults, anything announced.]
1. The problem: the KV cache eats your GPU
An autoregressive model generates one token at a time. To avoid recomputing attention over the whole prompt each step, it stores the keys and values for every previous token: the KV cache.
The size is easy to calculate:
KV bytes per token = 2 (K and V) × layers × kv_heads × head_dim × bytes_per_elementFor Llama-3.1-8B (32 layers, 8 KV heads, head_dim 128, BF16):
2 × 32 × 8 × 128 × 2 bytes = 131,072 bytes = 128 KiB per tokenAn 8K-token context is therefore about 1 GiB per request. For a 70B-class model (80 layers) it is about 320 KiB per token, so 2.5 GiB for that same 8K context. Concurrency on a GPU is bounded far more by KV cache than by weights once the model fits.
This is why “how many concurrent users can one GPU serve?” has no fixed answer. It depends on context length distribution.
2. PagedAttention: virtual memory for the KV cache
Early serving systems reserved one contiguous slab per request sized for the maximum length. Most of it went unused, and fragmentation wasted more.
vLLM’s core idea, PagedAttention, borrows from OS virtual memory:
- The KV cache is split into fixed-size blocks (a block holds a small number of tokens).
- Each request has a block table mapping its logical token positions to physical blocks.
- Blocks are allocated on demand as a sequence grows and freed when it ends.
- Identical prefixes can share physical blocks between requests.
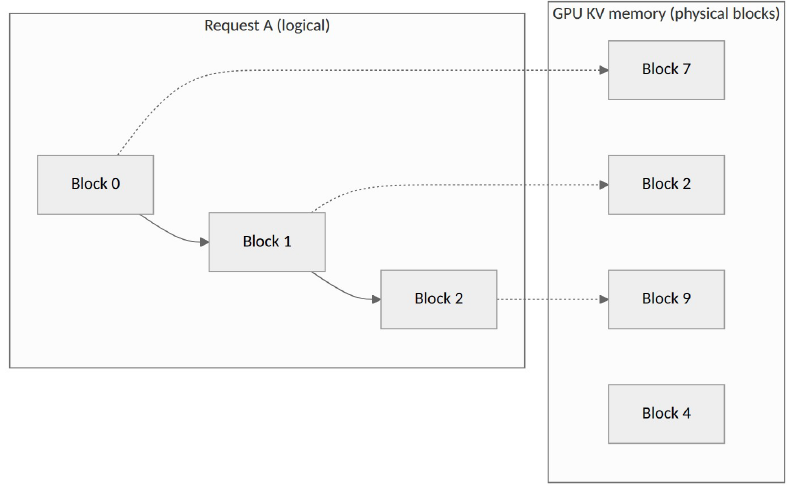
Consequences you can observe in production:
- Near-zero internal fragmentation, so far higher batch sizes for the same memory.
- Prefix caching falls out naturally: if two requests share a system prompt, they point at the same blocks.
- Preemption is possible: blocks can be evicted and recomputed (or swapped) under pressure.
3. Continuous batching and the scheduler
Static batching waits for a batch to fill and for the slowest sequence to finish. vLLM instead uses continuous batching: on every engine step, the scheduler decides which sequences run, and new requests join without waiting for others to finish.
Each step mixes two kinds of work:
| Phase | What it does | Bottleneck |
|---|---|---|
| Prefill | Processes the whole prompt in parallel | Compute-bound |
| Decode | Generates one token per running sequence | Memory-bandwidth-bound |
A giant prompt could monopolize a step and stall everyone’s decoding. Chunked prefill solves this by splitting long prompts into pieces that share a step with decode tokens, capped by a token budget.
The knobs that matter most:
vllm serve meta-llama/Llama-3.1-8B-Instruct \
  --max-model-len 16384 \
  --max-num-seqs 256 \
  --max-num-batched-tokens 8192 \
--gpu-memory-utilization 0.90--max-model-len: caps context; directly sets worst-case KV per request.--max-num-seqs: caps concurrent sequences per step.--max-num-batched-tokens: the per-step token budget (prefill chunk size vs decode fairness).--gpu-memory-utilization: the fraction of GPU memory vLLM may claim; the remainder after weights and activations becomes KV cache.
At startup, vLLM profiles a forward pass, subtracts weights and peak activations from the allowed memory, and logs how many KV cache blocks it can hold. Read that log line: it is your real capacity number.
4. From checkpoint to running model
A Hugging Face checkpoint is a config plus a set of weight shards. Getting from that to a serving-ready model involves several steps:
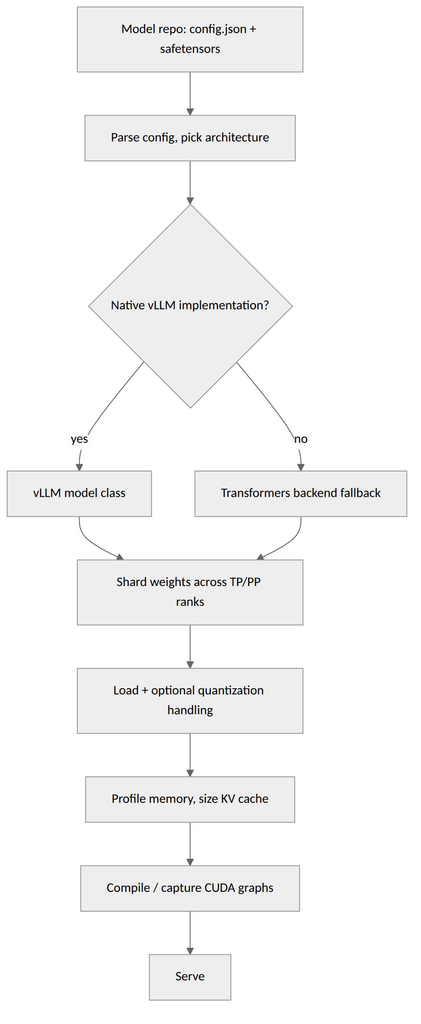
Key points:
- Native implementations are hand-tuned for speed and support features like tensor parallelism, quantization, and fused kernels.
- The Transformers backend lets vLLM run architectures that don’t yet have a native implementation, trading peak performance for day-one coverage. You can force it with
--model-impl transformers, which is useful for testing new models. - Sharding happens at load time: with tensor parallelism, each rank loads only its slice of each weight matrix.
- Load time is often dominated by I/O. Pulling hundreds of GB from network storage on every pod start is a platform problem: cache weights on local NVMe, or use a fast shared filesystem or object-store cache.
[Add from talk: Harry Mellor’s specifics: how the Transformers backend is wired, what’s supported, performance gap versus native.]
5. torch.compile and CUDA graphs
Two mechanisms explain why vLLM’s first start is slow and later starts are faster:
torch.compile: vLLM compiles the model graph to fuse operations and generate optimized kernels. Compilation takes time, so results are cached on disk. Persist that cache (a volume or baked image layer) or every new pod pays the cost again.- CUDA graphs: decode steps launch many tiny kernels. Capturing them as a graph and replaying it removes launch overhead, which matters most at small batch sizes. Graphs are captured for a set of batch sizes at startup, which adds to warmup time and some memory.
The operational takeaway: cold-start time is the sum of weight load + compile + graph capture. When autoscaling matters, measure all three separately.
[Add from talk: Richard Zou’s PyTorch integration details: compile-cache improvements, custom-op registration, anything that changes these numbers.]
6. What to watch in production
vLLM exposes Prometheus metrics. Names vary between versions, so verify against yours, but the signals are:
- Time to first token (TTFT): dominated by queueing + prefill.
- Inter-token latency / time per output token: dominated by decode step time and batch size.
- Requests waiting vs running: queue depth is your best scaling signal.
- KV cache usage: sustained high usage means preemptions are coming.
- Prefix cache hit rate: tells you if your routing and prompt structure are working.
Design-review checklist
- Do we know our real context-length distribution, not just the model maximum?
- Did we compute KV bytes per token and check it against the KV blocks vLLM reports at startup?
- Are the compile cache and model weights cached across pod restarts?
- Is our scale-out signal queue depth (not CPU)?
- Have we measured cold start as load + compile + graph capture?

Retina Scanning and Biometric Security: What You Need to Know About Privacy and Data Protection
DGX SuperPOD Deployment Guide: BCM, Kubernetes & Slurm

CUCM AXL API – Bulk Logout of Extension Mobility Profile Using Python
About Author

abhishek
Cloud Platform Lead and AI Infrastructure Architect at e& enterprise, with 12+ years in data center, virtualization, security and AI infrastructure. I design and build private cloud and sovereign AI platforms, working with VMware (NSX-T, vSphere, vSAN, HCX, AVS, SRM), Kubernetes, Terraform and GPU inference infrastructure for LLMs. Previously served Networkers Home (CCIE instructor, trained around 50 CCIEs), VCE/EMC2, Cisco, VMware and Arista across TAC, consulting, design and training. Certifications: CCIE#48639 (Data Center and R&S), VCIX-DCV and NV, CKA, NVIDIA AI Infrastructure, Azure Solutions Architect Expert, Terraform Associate, Palo Alto PCNSE. LinkedIn: https://www.linkedin.com/in/abhishekkunal51/