NVIDIA GPU Node on Kubernetes: 4-Layer Architecture & Troubleshooting
Part 5 of the Falcon AI workbook series explains what actually runs on an NVIDIA GPU node in Kubernetes and why each component matters.
At this stage, gpu-wk-01 and gpu-wk-02 are ready, with nvidia.com/gpu: 8 available on each node. However, seeing GPUs as allocatable resources does not explain how the complete GPU stack works.
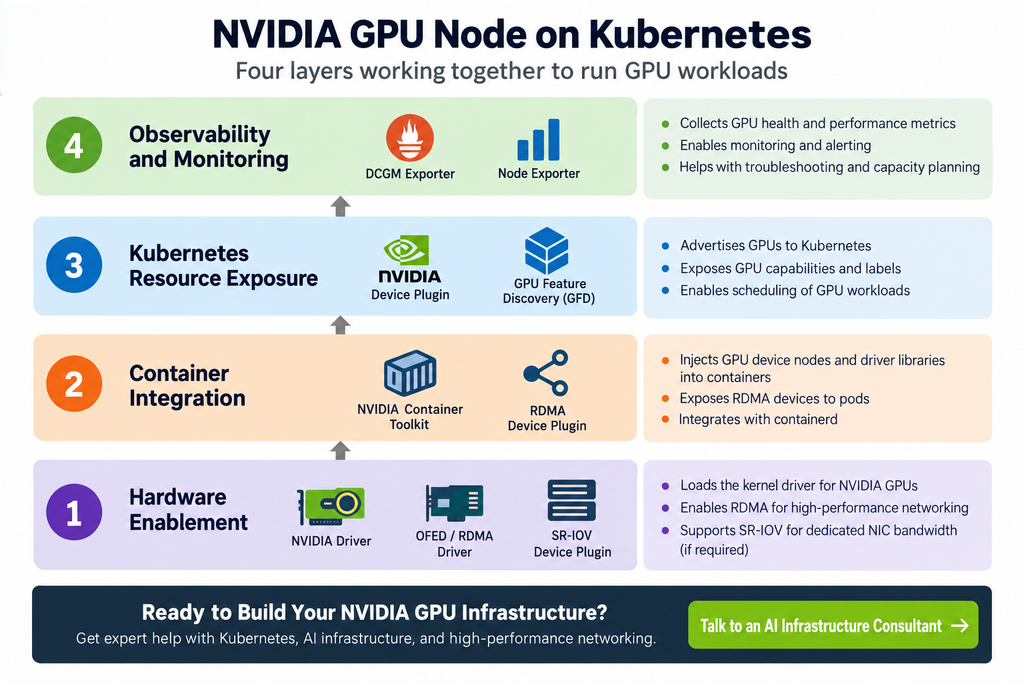
First, we examine the hardware layer, including the NVIDIA driver and RDMA components. Next, we look at the NVIDIA Container Toolkit and how it exposes GPUs to containers. Then, we examine how Kubernetes discovers and advertises GPU resources through the NVIDIA Device Plugin and GPU Feature Discovery. Finally, we explore DCGM Exporter, Node Exporter, and the observability layer.
Understanding these four layers makes NVIDIA GPU troubleshooting much easier. Instead of treating every failure as a generic Kubernetes problem, you can identify the affected layer and check the right component first.
Prerequisite
You’ve completed Part 4:
gpu-wk-01andgpu-wk-02areReady, joined to the cluster, with GPU Operator and Network Operator DaemonSets deployed to both.kubectl describe node gpu-wk-01showsnvidia.com/gpu: 8under Allocatable.
Recap: where Falcon AI stands
| Role | Count | Hostnames | Status after Part 4 |
|---|---|---|---|
| Management (control plane) | 3 | mgmt-01, mgmt-02, mgmt-03 | Ready, tainted NoSchedule |
| GPU worker | 2 | gpu-wk-01, gpu-wk-02 | Ready, nvidia.com/gpu: 8 Allocatable each |
| Load balancer | 1 | k8s-lb | Fronting API server on :6443 |
The full node stack, layered
Everything installed on a GPU node falls into four layers, each depending on the one below it. This layering is the single most useful mental model for troubleshooting — a symptom in layer 3 is almost always caused by something in layer 1 or 2.

Why this order matters: if the driver (Layer 1) isn’t loaded, the container toolkit (Layer 2) has nothing to expose, the device plugin (Layer 3) has nothing to advertise, and DCGM (Layer 4) has nothing to measure. A CrashLoopBackOff on DCGM exporter is very often actually a driver problem one layer down — check bottom-up, not top-down.
Layer 1 — Hardware Enablement
| Component | What it does | Falcon AI relevance |
|---|---|---|
| NVIDIA Driver | Kernel module that lets the OS talk to the physical GPU | Deployed as a DaemonSet pod per Part 2’s driver.enabled=true — no manual install |
| OFED / RDMA Driver | Kernel-level driver for InfiniBand/RoCE NICs | Required for the 400Gb RoCE NICs on gpu-wk-01/02 — without it, GPUs work but multi-node NCCL training falls back to slow TCP |
| SR-IOV Device Plugin | Carves a physical NIC into virtual functions (VFs) | Only relevant if Falcon AI later needs per-pod dedicated NIC bandwidth rather than shared RDMA |
Inspect on mgmt-01:
kubectl get pods -n gpu-operator -l app=nvidia-driver-daemonset -o wide
kubectl exec -it -n gpu-operator <driver-pod-name> -- nvidia-smi
Expected: nvidia-smi output showing all 8 H100s, driver version, and CUDA version — run from inside the driver pod, confirming the kernel module actually loaded.
Layer 2 — Container Integration
| Component | What it does |
|---|---|
| NVIDIA Container Toolkit | Injects GPU device nodes and driver libraries into containers at runtime — this is what makes docker run --gpus all (or the K8s equivalent) work |
| RDMA Device Plugin | Exposes RDMA devices to pods the same way the GPU device plugin exposes GPUs |
This is the layer that modified containerd on your GPU nodes — recall from Part 1 we noted the runtime would get “an NVIDIA runtime hook injected” later. This is that moment:
# On gpu-wk-01
cat /etc/containerd/config.toml | grep -A3 nvidia
Expected: an nvidia runtime section added by the toolkit, alongside the default runc runtime you configured manually in Part 1.
Layer 3 — Kubernetes Resource Exposure
This is the layer that turns “GPU exists on this box” into “Kubernetes scheduler knows about it.”
| Component | What it does |
|---|---|
| Device Plugin | Advertises GPUs to kubelet as Extended Resources (nvidia.com/gpu) — this is literally where the Allocatable: nvidia.com/gpu: 8 from Part 4 comes from |
| GPU Feature Discovery (GFD) | Adds detailed labels — GPU model, memory size, compute capability, MIG capability — used for node affinity later |
| MIG Manager | If MIG mode is enabled, partitions physical GPUs into isolated slices and updates advertised resources accordingly (we cover MIG vs time-slicing in depth in a later post) |
| CSI Node Plugin | Mounts persistent volumes (checkpoints, datasets, model weights) onto the node |
kubectl get node gpu-wk-01 --show-labels | tr ',' '\n' | grep nvidiaExpected labels including nvidia.com/gpu.product=NVIDIA-H100-..., nvidia.com/gpu.memory=..., nvidia.com/mig.capable=true.
Layer 4 — Observability & Ops
| Component | What it does |
|---|---|
| DCGM Exporter | Exposes GPU-level telemetry (utilization, temperature, ECC errors, power) as Prometheus metrics |
| Node Exporter | Standard CPU/memory/disk/network metrics — not GPU-specific, but essential context |
| Logging Agent (Fluent Bit/Promtail) | Ships container and system logs off-node |
| OpenTelemetry Agent | Collects traces/metrics/logs in a vendor-neutral format, if Falcon AI adopts distributed tracing for its inference services later |
bash
kubectl get pods -n gpu-operator -l app=nvidia-dcgm-exporter -o wide
kubectl exec -it -n gpu-operator <dcgm-pod-name> -- dcgm-exporter --version
We’ll wire these into an actual Grafana dashboard in the Observability post later in the series — for now, just confirm the exporter pod is Running.
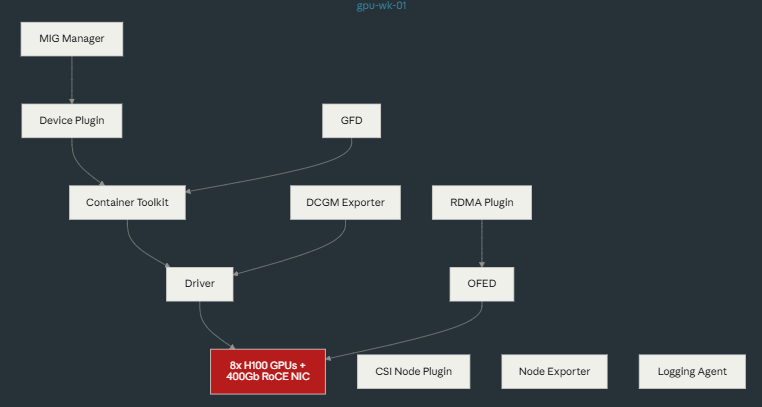
Full picture: one node, ten components
Troubleshooting checkpoint
| Symptom | Check this layer first |
|---|---|
nvidia-smi fails inside driver pod | Layer 1 — check Secure Boot, kernel headers, dmesg for module load errors |
| Pods can request GPU but toolkit errors at container start | Layer 2 — check containerd config was actually patched |
Allocatable: nvidia.com/gpu missing or wrong count | Layer 3 — device plugin pod status and logs |
| DCGM metrics missing or zero | Layer 4, but verify Layer 1 first — DCGM reads from the driver |
Conclusion: Understanding the NVIDIA GPU Node Stack
Running NVIDIA GPUs on Kubernetes involves much more than installing a GPU driver. A production GPU node depends on several interconnected components working together across the hardware, container, Kubernetes, and observability layers.
First, the NVIDIA driver enables communication between the operating system and the physical GPU. Next, the NVIDIA Container Toolkit makes GPU resources available inside containers. Then, the NVIDIA Device Plugin and GPU Feature Discovery expose those resources and capabilities to Kubernetes. Finally, tools such as DCGM Exporter provide the telemetry required to monitor GPU health and performance.
Therefore, troubleshooting should follow the same order—from the bottom up. If a higher layer fails, always verify the layers beneath it first. This approach helps isolate problems faster and reduces unnecessary troubleshooting across the Kubernetes cluster.
At this stage, Falcon AI’s GPU workers are ready for deeper cluster validation. Next, Part 6 will validate infrastructure, GPU health, networking, storage, scheduling, and observability before production workloads are introduced.
Need Help Building NVIDIA GPU Infrastructure?
Planning or deploying NVIDIA GPU clusters, Kubernetes AI infrastructure, high-performance networking, or enterprise AI platforms?
Trezbon provides consulting and implementation services for enterprise infrastructure, networking, security, Kubernetes, and AI environments.
Talk to Trezbon about your GPU and AI infrastructure requirements:
https://trezbon.com/#contact
Where we are
✅ Understand the four-layer stack on every GPU node and why the order matters for troubleshooting ✅ Verified driver, toolkit, device plugin, GFD, and DCGM exporter are all functioning on gpu-wk-01 ✅ Know exactly which component to check first for each class of symptom
Next in the series: Part 6 — Validating Cluster Readiness, where we run the full six-category checklist (infrastructure, GPU health, network, storage, scheduling, observability) end to end, using the commands from this post plus a few new ones.

Enterprise Private LLM Infrastructure: Architecture, Sizing & High-Performance Networking
NVIDIA GPU Workloads on Kubernetes Part 7: Running GPU Test Jobs
NVIDIA GPU Workloads on Kubernetes — Part 8: Building the AI Platform & Application Layer
About Author

abhishek
Cloud Platform Lead and AI Infrastructure Architect at e& enterprise, with 12+ years in data center, virtualization, security and AI infrastructure. I design and build private cloud and sovereign AI platforms, working with VMware (NSX-T, vSphere, vSAN, HCX, AVS, SRM), Kubernetes, Terraform and GPU inference infrastructure for LLMs. Previously served Networkers Home (CCIE instructor, trained around 50 CCIEs), VCE/EMC2, Cisco, VMware and Arista across TAC, consulting, design and training. Certifications: CCIE#48639 (Data Center and R&S), VCIX-DCV and NV, CKA, NVIDIA AI Infrastructure, Azure Solutions Architect Expert, Terraform Associate, Palo Alto PCNSE. LinkedIn: https://www.linkedin.com/in/abhishekkunal51/