NVIDIA GPU Workloads on Kubernetes — Part 10: MIG vs Time-Slicing — Choosing a GPU Sharing Mode
Part 10 of the Falcon AI workbook series. Every post so far treated each H100 as a single, whole unit of scheduling. This post changes that assumption — and uses the observability stack from Part 9 to actually show the difference rather than just describe it.
Prerequisite
You’ve completed Part 9: Prometheus, Grafana, and DCGM dashboards are live and showing real per-GPU utilization data for
gpu-wk-01/gpu-wk-02.
Recap: where Falcon AI stands
| Role | Count | Hostnames | Status after Part 9 |
|---|---|---|---|
| Management (control plane) | 3 | mgmt-01, mgmt-02, mgmt-03 | Ready, tainted NoSchedule |
| GPU worker | 2 | gpu-wk-01, gpu-wk-02 | Ready, full observability stack live |
Why this decision matters at Falcon AI’s scale
16 GPUs across 2 nodes is enough for serious training, but it’s not infinite. Once notebooks, small inference tests, and hyperparameter sweeps start competing with large training jobs for the same pool, whole-GPU scheduling wastes capacity — a Jupyter notebook doing exploratory data analysis doesn’t need a full H100. Sharing modes exist to close that gap. The two mechanisms work completely differently, and picking the wrong one for a given workload has real cost and reliability consequences.
The core mechanism difference
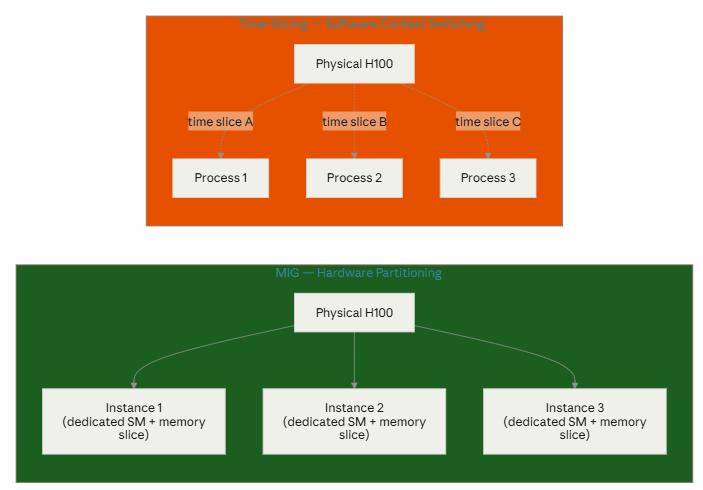
MIG carves the physical GPU into genuinely isolated instances at the hardware level — each gets dedicated streaming multiprocessors and a fixed memory slice, walled off from the others. Time-slicing keeps the whole GPU as one unit but rapidly switches which process is executing, the way a CPU scheduler multiplexes cores — no hardware isolation, so one noisy process can starve the others.
The full comparison
| Feature | MIG (Multi-Instance GPU) | Time-Slicing |
|---|---|---|
| Mechanism | Hardware partitioning | Software context switching |
| Isolation | Strong (hardware level) | Weak (shared GPU) |
| Memory | Dedicated | Shared |
| Performance | Predictable / guaranteed | Variable |
| Noisy neighbor risk | No | Yes |
| Fault isolation | Excellent | Poor |
| K8s resource name | nvidia.com/mig-<profile> (e.g. mig-1g.5gb) | nvidia.com/gpu (virtualized count) |
| Best for | Production, multi-tenant, latency-sensitive | Dev/test, best-effort, short jobs |
Mapping this to Falcon AI’s actual workloads
| Falcon AI workload | Recommended mode | Why |
|---|---|---|
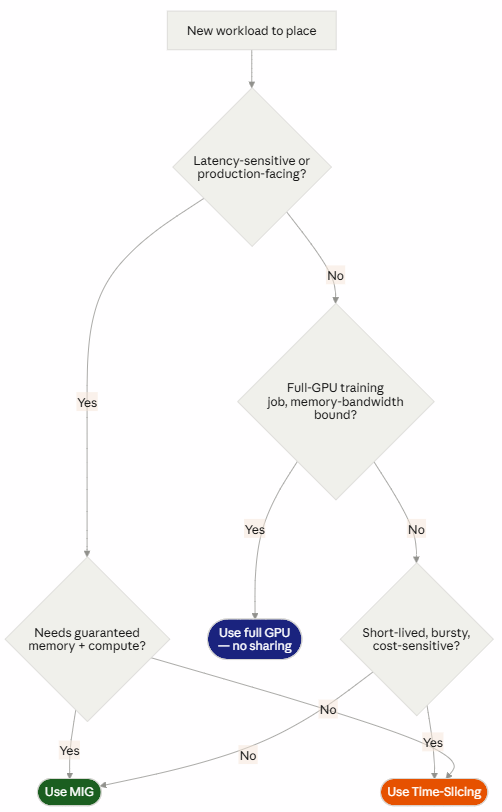
| KServe production inference endpoint (Part 8) | MIG | Predictable latency matters for a serving SLA; noisy-neighbor variance is unacceptable |
| ML engineer’s Kubeflow notebook, exploratory work | Time-slicing | Bursty, low-utilization, tolerates variable performance, needs many cheap slots more than guaranteed throughput |
| Multi-node NCCL/MPIJob training (Part 8) | Neither — full GPU | Distributed training wants the entire physical GPU’s SMs and memory bandwidth; partitioning would hurt, not help |
| CI/CD smoke tests (Rung 1 of Part 7’s ladder, run continuously) | Time-slicing | Short-lived, low-stakes, just needs “a GPU,” not “the best possible GPU” |
Decision flowchart
Step 1 — Enable MIG on a subset of GPUs (on gpu-wk-01)
Falcon AI doesn’t need to commit its whole fleet to one mode — MIG can be enabled per-node, even per-GPU. We’ll dedicate 2 of gpu-wk-01‘s 8 H100s to MIG for the KServe inference workload, leaving the rest full-GPU for training.
kubectl label node gpu-wk-01 nvidia.com/mig.config=all-1g.10gb --overwriteThe MIG Manager (installed as part of the GPU Operator back in Part 2) picks up this label and reconfigures the labeled GPUs automatically — same reconcile pattern from Part 3, just triggered by a label instead of a node join.
kubectl get pods -n gpu-operator -l app=nvidia-mig-manager -o wide -wPass criteria:
kubectl describe node gpu-wk-01 | grep migExpected: nvidia.com/mig-1g.10gb listed under Allocatable with the correct instance count.
Step 2 — Enable time-slicing on the remaining GPUs (cluster-wide default, or per-node)
yaml
# time-slicing-config.yaml
apiVersion: v1
kind: ConfigMap
metadata:
  name: time-slicing-config
  namespace: gpu-operator
data:
  any: |-
    version: v1
    sharing:
      timeSlicing:
        resources:
        - name: nvidia.com/gpu
          replicas: 4
kubectl apply -f time-slicing-config.yaml
kubectl patch clusterpolicy cluster-policy --type merge -p \
'{"spec": {"devicePlugin": {"config": {"name": "time-slicing-config"}}}}'Pass criteria:
kubectl describe node gpu-wk-01 | grep "nvidia.com/gpu"Expected: Allocatable now shows 4x the physical GPU count on time-sliced GPUs (replicas: 4 — four workloads can share each physical device).
Step 3 — Validate with the observability stack from Part 9
This is where Part 9 pays off directly — pull up the DCGM Exporter Grafana dashboard and compare:
- A MIG instance’s utilization graph should show a flat, dedicated ceiling regardless of what else runs on the parent GPU
- A time-sliced GPU’s utilization graph should show visible contention — total utilization climbing but individual process throughput dropping as more processes share the same physical device
If you don’t see that pattern, something’s misconfigured — go back to Step 1 or 2 before trusting the sharing mode in production.
Where we are
✅ Understand the hardware-partitioning vs software-context-switching distinction concretely, not just by definition ✅ MIG enabled on 2 of gpu-wk-01‘s GPUs for the KServe inference workload ✅ Time-slicing enabled on the remainder for notebooks and short-lived jobs ✅ Used Part 9’s Grafana dashboards to visually confirm both modes behave as expected
Next in the series: Part 11 — Key Concepts Deep Dive, covering RuntimeClass, taints/tolerations, node affinity/topology, and gang scheduling in more depth than we’ve touched on so far — the last set of building blocks before this workbook is a complete reference.
Choosing the Right Networking Solution is Essential for AI Success
NVIDIA GPU Workloads on Kubernetes — Part 9: Observability Stack for GPU Clusters
NSX-T ALB AVI Series : Part01
About Author

abhishek
Expert in Network, Virtualization and Security field in On-Prem and Public Cloud. Passionate about new technology and consult the best solution to business organisation.Previously served Networkershome, EMC2, Cisco, VMware and Arista in different fields of Engineering, TAC, Consulting, Designing and Training. Certification : CCIE#48639, VCIX DCV and NV, Aviatrix Multi Cloud, SD-WAN Specialist, Palo Alto PCNSE, Amazon Cloud, Docker Certified Engineer. LinkedIn : https://www.linkedin.com/in/abhishekkunal51/