Kubernetes GPU Monitoring: Prometheus, Grafana & DCGM Guide
Part 9 of the Falcon AI workbook series. Parts 5 and 6 confirmed DCGM Exporter and Node Exporter pods were Running — but “Running” isn’t the same as “wired into a dashboard someone actually looks at.” This post closes that gap: full-stack observability for cluster, nodes, GPUs, network, and the application layer from Part 8.
Prerequisite
You’ve completed Part 8: Kubeflow, KServe, Ray, MPI Operator, and Volcano are installed and running real jobs. DCGM Exporter and Node Exporter pods have been confirmed
Runningsince Part 5 but aren’t yet feeding anywhere.
Recap: where Falcon AI stands
| Role | Count | Hostnames | Status after Part 8 |
|---|---|---|---|
| Management (control plane) | 3 | mgmt-01, mgmt-02, mgmt-03 | Ready, tainted NoSchedule |
| GPU worker | 2 | gpu-wk-01, gpu-wk-02 | Ready, running real Kubeflow/KServe/MPIJob workloads |
Why Kubernetes GPU Monitoring Needs More Than Prometheus
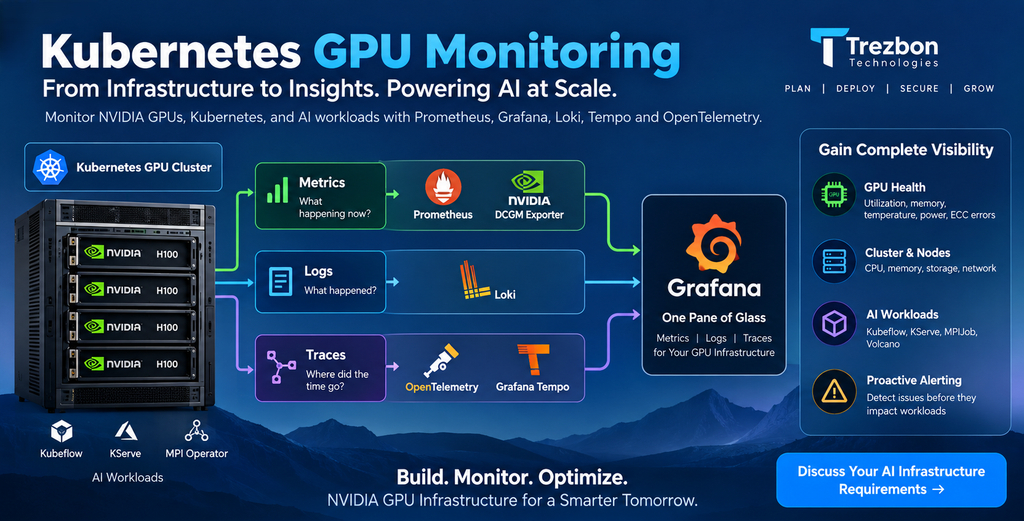
A standard Kubernetes monitoring stack does not provide complete visibility into GPU infrastructure. Two areas are especially important: GPU telemetry and fabric telemetry.
GPU telemetry includes utilization, temperature, power consumption, memory usage, and ECC errors. Meanwhile, fabric telemetry helps expose network and RDMA issues that can affect distributed AI workloads.
Therefore, a production GPU observability stack should combine these signals with standard Kubernetes metrics.
The Three Pillars of GPU Observability: Metrics, Logs and Traces
Metrics show the current state of the infrastructure. For example, they can tell you that GPU utilization has reached 94%.
Logs explain what happened. For instance, they can reveal that a pod terminated because of an out-of-memory error.
Traces, on the other hand, show where application time is being spent. This is particularly useful for analyzing KServe inference latency.
Together, these signals provide a more complete view of GPU infrastructure and application performance.
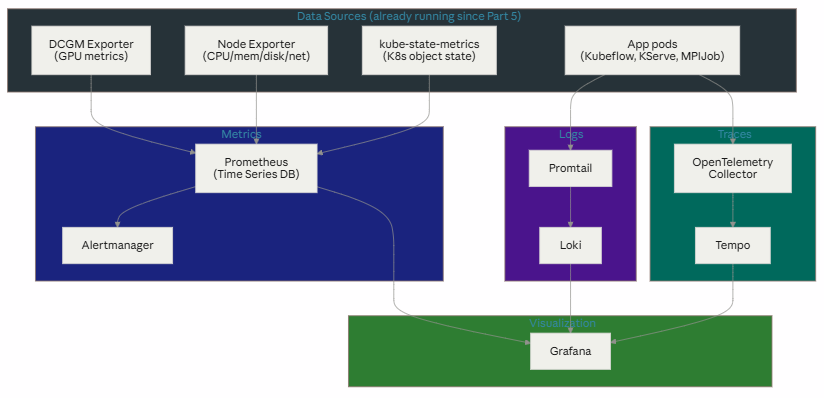
Metrics answer “what is the current state” (GPU util is 94%). Logs answer “what happened” (this pod crashed with OOM at 14:32). Traces answer “where did the time go” (this inference request spent 340ms in the KServe predictor). All three converge in Grafana as one pane of glass.
Step 1 — Install Prometheus for Kubernetes GPU Monitoring
bash
helm repo add prometheus-community https://prometheus-community.github.io/helm-charts
helm repo update

kubectl create namespace monitoring

helm install kube-prometheus-stack prometheus-community/kube-prometheus-stack \
  --namespace monitoring \
  --set prometheus.prometheusSpec.serviceMonitorSelectorNilUsesHelmValues=false
kubectl get pods -n monitoringPass criteria: prometheus-, alertmanager-, and grafana- pods Running. This single chart brings Prometheus, Alertmanager, Grafana, and kube-state-metrics together — the four boxes at the top and bottom-right of the diagram above.
Step 2 — Connect NVIDIA DCGM Exporter to Prometheus
DCGM Exporter has been running since Part 5, but Prometheus won’t scrape it without a ServiceMonitor telling it where to look:
yaml
# dcgm-servicemonitor.yaml
apiVersion: monitoring.coreos.com/v1
kind: ServiceMonitor
metadata:
  name: dcgm-exporter
  namespace: monitoring
  labels:
    release: kube-prometheus-stack
spec:
  selector:
    matchLabels:
      app: nvidia-dcgm-exporter
  namespaceSelector:
    matchNames:
    - gpu-operator
  endpoints:
  - port: gpu-metrics
    interval: 15s
kubectl apply -f dcgm-servicemonitor.yamlPass criteria:
kubectl -n monitoring port-forward svc/kube-prometheus-stack-prometheus 9090:9090Open localhost:9090/targets — dcgm-exporter should show state: UP for both gpu-wk-01 and gpu-wk-02.
Step 3 — Add Kubernetes Log Monitoring with Loki
helm repo add grafana https://grafana.github.io/helm-charts
helm repo update

helm install loki grafana/loki-stack \
  --namespace monitoring \
  --set promtail.enabled=true \
  --set loki.persistence.enabled=true \
  --set loki.persistence.size=50Gi
Pass criteria:
kubectl get pods -n monitoring -l app=promtail -o wideOne Promtail pod per node (including gpu-wk-01/gpu-wk-02), Running.
Step 4 — Add Distributed Tracing with OpenTelemetry and Tempo
Traces matter most for the KServe inference path from Part 8 — this is what lets Falcon AI see where latency actually goes inside a serving request.
helm install tempo grafana/tempo --namespace monitoring

helm repo add open-telemetry https://open-telemetry.github.io/opentelemetry-helm-charts
helm install otel-collector open-telemetry/opentelemetry-collector \
  --namespace monitoring \
  --set mode=daemonset \
  --set config.exporters.otlp.endpoint=tempo.monitoring.svc.cluster.local:4317
Pass criteria:
kubectl get pods -n monitoring -l app.kubernetes.io/name=opentelemetry-collector -o wideOne collector pod per node, Running.
Step 5 — Build the Kubernetes GPU Monitoring Dashboard in Grafana
kubectl -n monitoring port-forward svc/kube-prometheus-stack-grafana 3000:80
# default credentials: admin / prom-operator (check Helm chart notes to confirm)
Import these dashboards (Grafana.com dashboard IDs, or build custom):
| Dashboard | Grafana ID | Shows |
|---|---|---|
| NVIDIA DCGM Exporter | 12239 | Per-GPU utilization, memory, temperature, power, ECC errors |
| Node Exporter Full | 1860 | CPU, memory, disk, network per node |
| Kubernetes / Compute Resources | 315 | Namespace-level resource usage (Kubeflow, KServe, MPIJob pods) |
Add Loki and Tempo as data sources in Grafana (Configuration → Data Sources) so logs and traces are queryable alongside metrics, not in separate tools.
Step 6 — Configure NVIDIA GPU Health Alerts
DCGM ECC errors are the single most useful GPU alert to have — they’re often the earliest signal of failing hardware, well before a job crashes outright:
yaml
# dcgm-alerts.yaml
apiVersion: monitoring.coreos.com/v1
kind: PrometheusRule
metadata:
  name: dcgm-ecc-alerts
  namespace: monitoring
  labels:
    release: kube-prometheus-stack
spec:
  groups:
  - name: gpu-health
    rules:
    - alert: GPUUncorrectableECCErrors
      expr: DCGM_FI_DEV_ECC_DBE_VOL_TOTAL > 0
      for: 5m
      labels:
        severity: critical
      annotations:
        summary: "Uncorrectable ECC error on {{ $labels.instance }}"
kubectl apply -f dcgm-alerts.yamlKubernetes GPU Observability Stack: Final Architecture
✅ Full metrics/logs/traces stack installed and wired to Grafana as one pane of glass ✅ DCGM Exporter, Node Exporter, and application-layer pods all confirmed feeding Prometheus ✅ Loki capturing logs and Tempo capturing traces from Kubeflow/KServe/MPIJob workloads ✅ First real alert configured for GPU ECC errors — Falcon AI now finds out about failing hardware before a job does
Conclusion: Build a Complete Kubernetes GPU Monitoring Stack
Running NVIDIA GPU workloads on Kubernetes is only the beginning. Production AI infrastructure also needs visibility into GPU health, utilization, node performance, application behavior, logs, and distributed traces.
In this part of the Falcon AI workbook, we built a Kubernetes GPU monitoring and observability stack around Prometheus, Grafana, NVIDIA DCGM Exporter, Loki, Tempo, and OpenTelemetry. Together, these tools provide visibility from the Kubernetes cluster and worker nodes down to individual GPUs and application requests.
More importantly, GPU-specific monitoring helps infrastructure teams identify problems that traditional Kubernetes metrics can miss. GPU utilization, temperature, memory consumption, power, ECC errors, and application latency can provide early indicators of performance or hardware problems.
Therefore, observability should not be treated as an optional layer added after an AI platform reaches production. It should be part of the GPU infrastructure architecture from the beginning.
With monitoring now in place, Falcon AI is ready for the next challenge: improving GPU utilization. Part 10 explores NVIDIA MIG vs time-slicing and uses the observability stack built here to evaluate different Kubernetes GPU sharing strategies.
Conversion-focused CTA
Your technical readers are likely infrastructure architects, platform engineers, MLOps teams, and organizations planning GPU environments. So I would make the CTA directly relevant to their problem:
Building NVIDIA GPU Infrastructure on Kubernetes?
Designing a production AI platform involves more than deploying GPUs. Kubernetes architecture, GPU sizing, observability, networking, storage, scheduling, inference, and workload performance all need to work together.
Trezbon Technologies helps organizations design, deploy, assess, and optimize NVIDIA GPU and Kubernetes infrastructure for AI and machine learning workloads.
Whether you’re building a new GPU cluster or optimizing an existing environment, our team can help identify infrastructure gaps and develop a scalable architecture for your AI workloads.
Next in the series: Part 10 — MIG vs Time-Slicing: Choosing a GPU Sharing Mode, where we put the observability stack built here to immediate use — comparing real utilization and isolation characteristics between the two sharing modes on Falcon AI’s H100s.
Kubernetes for AI/ML Workloads: GPU Scheduling & MLOps Guide
NVIDIA GPU Kubernetes Cluster Validation: Complete Readiness Checklist | Part 6
NVIDIA MIG vs Time-Slicing on Kubernetes: GPU Sharing Guide
About Author

abhishek
Cloud Platform Lead and AI Infrastructure Architect at e& enterprise, with 12+ years in data center, virtualization, security and AI infrastructure. I design and build private cloud and sovereign AI platforms, working with VMware (NSX-T, vSphere, vSAN, HCX, AVS, SRM), Kubernetes, Terraform and GPU inference infrastructure for LLMs. Previously served Networkers Home (CCIE instructor, trained around 50 CCIEs), VCE/EMC2, Cisco, VMware and Arista across TAC, consulting, design and training. Certifications: CCIE#48639 (Data Center and R&S), VCIX-DCV and NV, CKA, NVIDIA AI Infrastructure, Azure Solutions Architect Expert, Terraform Associate, Palo Alto PCNSE. LinkedIn: https://www.linkedin.com/in/abhishekkunal51/