NVIDIA GPU Workloads on Kubernetes Part 7: Running GPU Test Jobs
Part 7 of the Falcon AI workbook series focuses on running NVIDIA GPU workloads on Kubernetes.
In Part 6, we validated the cluster across infrastructure, GPU health, networking, storage, scheduling, and observability. However, a healthy cluster does not automatically guarantee that real GPU workloads will run correctly.
Therefore, the next step is to test the environment end to end.
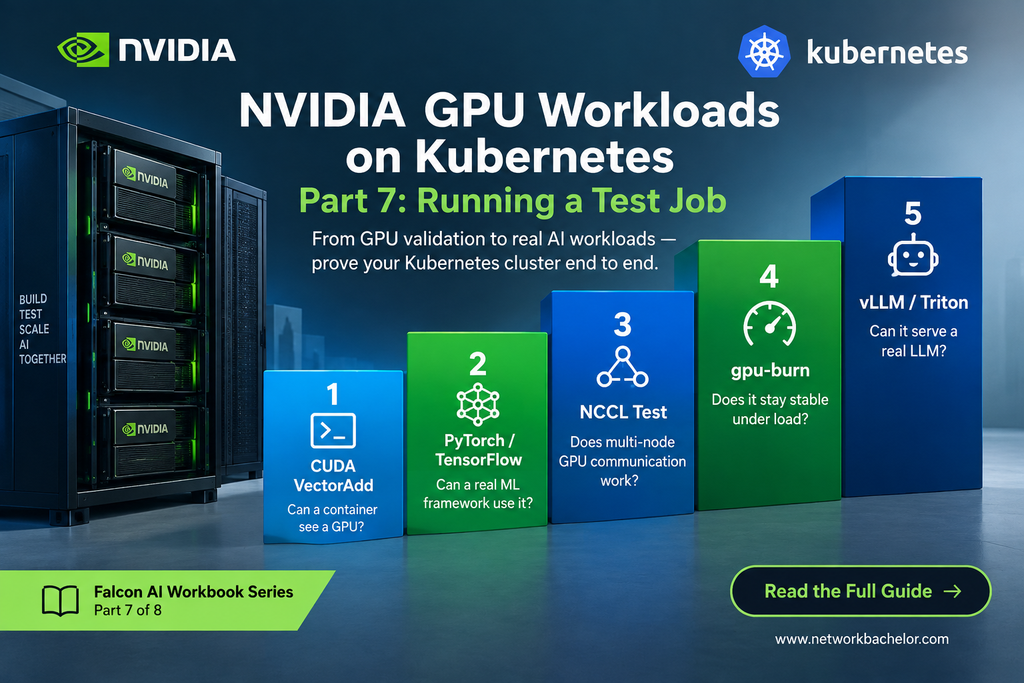
In this guide, we use a five-rung testing ladder. We start with a simple CUDA VectorAdd test and gradually progress through PyTorch, NCCL, GPU stress testing, and finally vLLM inference.
Each test validates a different part of the NVIDIA GPU and Kubernetes stack. As a result, when something fails, you can identify the problem faster instead of troubleshooting the entire platform at once.
Prerequisite
You’ve completed Part 6: all six validation categories (infrastructure, GPU health, network, storage, scheduling, observability) passed on the Falcon AI cluster. If any category was still failing, stop and go back — a test job passing on a partially-healthy cluster gives false confidence.
Recap: where Falcon AI stands
| Role | Count | Hostnames | Status after Part 6 |
|---|---|---|---|
| Management (control plane) | 3 | mgmt-01, mgmt-02, mgmt-03 | Ready, tainted NoSchedule |
| GPU worker | 2 | gpu-wk-01, gpu-wk-02 | Ready, validated across all 6 categories |
| Load balancer | 1 | k8s-lb | Fronting API server on :6443 |
Why a ladder, not one big test
A single “run PyTorch and see if it works” test tells you almost nothing when it fails — PyTorch failing could mean the driver, the toolkit, scheduling, networking, or the framework itself. Each rung below isolates one thing. Climb in order; stop and fix at the first rung that fails rather than skipping ahead.
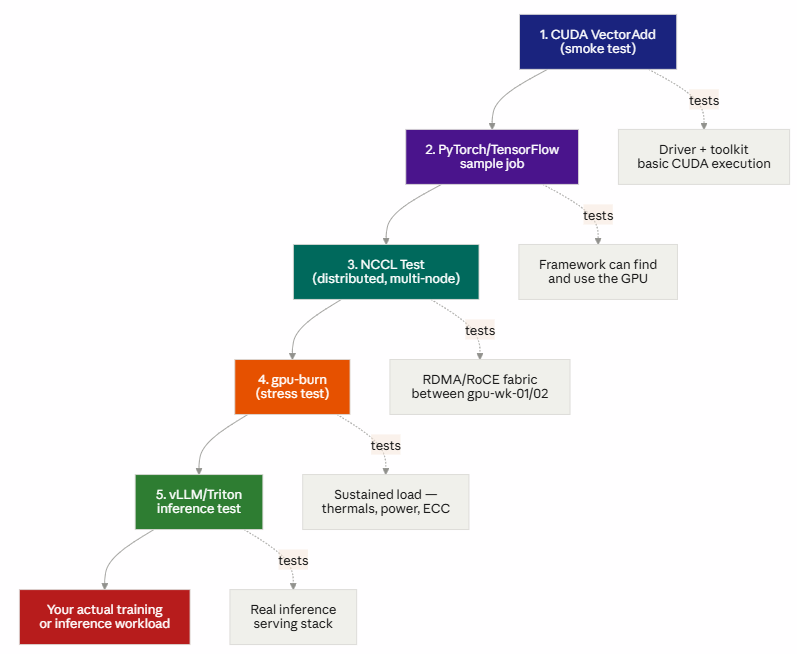
Each rung isolates a different failure domain — this is why we don’t skip straight to rung 5.
Rung 1 — CUDA VectorAdd (smoke test)
Simplest possible test: can a pod on gpu-wk-01 allocate a GPU and run any CUDA kernel at all.
# vectoradd.yaml
apiVersion: v1
kind: Pod
metadata:
  name: cuda-vectoradd
spec:
  restartPolicy: Never
  runtimeClassName: nvidia
  containers:
  - name: cuda-vectoradd
    image: nvcr.io/nvidia/k8s/cuda-sample:vectoradd-cuda11.7.1
    resources:
      limits:
        nvidia.com/gpu: 1
kubectl apply -f vectoradd.yaml
kubectl logs cuda-vectoraddPass criteria: logs end with Test PASSED. Failure here almost always points back to Part 5’s Layer 1 or 2 (driver/toolkit) — go back to that post’s troubleshooting table before touching anything else.
Once the basic CUDA test passes, the next step is to validate a real machine-learning framework.
Rung 2 — PyTorch/TensorFlow sample job
Confirms a real ML framework can find and use the GPU — a different code path than the raw CUDA sample above.
# pytorch-check.yaml
apiVersion: v1
kind: Pod
metadata:
  name: pytorch-gpu-check
spec:
  restartPolicy: Never
  runtimeClassName: nvidia
  containers:
  - name: pytorch
    image: pytorch/pytorch:2.3.0-cuda12.1-cudnn8-runtime
    command: ["python3", "-c", "import torch; print(torch.cuda.is_available()); print(torch.cuda.get_device_name(0))"]
    resources:
      limits:
        nvidia.com/gpu: 1
kubectl apply -f pytorch-check.yaml
kubectl logs pytorch-gpu-checkPass criteria: output shows True and the correct GPU model (NVIDIA H100...). Failure here with Rung 1 passing usually means a CUDA/framework version mismatch, not an infrastructure problem.
So far, the tests have focused mainly on GPU functionality within a node. Next, we need to validate distributed GPU communication.
Rung 3 — NCCL Test (distributed, multi-node)
This is the rung that actually exercises the RDMA fabric between gpu-wk-01 and gpu-wk-02 — the piece that Rungs 1–2 can’t test since they run on a single node.
kubectl exec -it -n network-operator <ofed-pod-gpu-wk-01> -- \
  nccl-tests/build/all_reduce_perf -b 8M -e 128M -f 2 -g 8
For a true multi-node run, this needs to launch across both gpu-wk-01 and gpu-wk-02 simultaneously — in practice you’d wrap this in an MPIJob (via the MPI Operator, covered in the AI Platform Layer post later in the series) rather than a bare kubectl exec. For now, a single-node 8-GPU run validates intra-node NVLink; cross-node validation reuses the same ib_write_bw/all_reduce_perf commands from Part 6’s Category C.
Pass criteria: completes without error; busbw figure roughly matches what you baselined in Part 6. A big regression from that baseline — even without an outright failure — is worth investigating before moving on.
At this stage, we know the GPUs can execute workloads and communicate correctly. However, production infrastructure must also remain stable under sustained load.
Rung 4 — gpu-burn (stress test)
Rungs 1–3 prove correctness. This rung proves the hardware holds up under sustained load — thermal throttling, power delivery, and ECC errors often only show up after several minutes, not several seconds.
yaml
# gpu-burn.yaml
apiVersion: v1
kind: Pod
metadata:
  name: gpu-burn
spec:
  restartPolicy: Never
  runtimeClassName: nvidia
  containers:
  - name: gpu-burn
    image: nvcr.io/nvidia/k8s/gpu-burn:latest
    args: ["300"]   # run for 300 seconds
    resources:
      limits:
        nvidia.com/gpu: 8
kubectl apply -f gpu-burn.yaml
kubectl logs -f gpu-burnPass criteria: all 8 GPUs report consistent GFLOPS throughout the run with no FAULTY result at the end. While this runs, check for thermal/ECC issues in parallel:
kubectl exec -it -n gpu-operator <driver-pod-gpu-wk-01> -- nvidia-smi -q -d TEMPERATURE,ECC

Finally, we move beyond synthetic validation and test a workload that closely resembles Falcon AI’s production environment.
Rung 5 — vLLM/Triton inference test
The first rung that resembles Falcon AI’s actual production use case — serving an LLM, not just running a synthetic benchmark.
helm repo add vllm https://vllm-project.github.io/helm-charts   # example; adjust to your chosen deployment method
kubectl create namespace inference-test

kubectl run vllm-test --image=vllm/vllm-openai:latest \
  --overrides='{"spec":{"runtimeClassName":"nvidia","containers":[{"name":"vllm-test","image":"vllm/vllm-openai:latest","args":["--model","facebook/opt-125m"],"resources":{"limits":{"nvidia.com/gpu":"1"}}}]}}' \
  -n inference-test
kubectl port-forward -n inference-test vllm-test 8000:8000
curl http://localhost:8000/v1/completions \
-H "Content-Type: application/json" \
-d '{"model": "facebook/opt-125m", "prompt": "Falcon AI is", "max_tokens": 20}'Pass criteria: a valid completion response returns with reasonable latency. This confirms the full stack — driver, toolkit, scheduling, networking, storage for model weights — works together for a realistic serving workload, not just isolated synthetic tests.
Troubleshooting checkpoint
| Rung fails | Most likely cause | Go back to |
|---|---|---|
| 1 (VectorAdd) | Driver/toolkit not functioning | Part 5, Layer 1–2 |
| 2 (PyTorch) | Framework/CUDA version mismatch | Check image tag vs driver CUDA version |
| 3 (NCCL) | RDMA fabric misconfigured | Part 6, Category C |
| 4 (gpu-burn) | Thermal/power issue, ECC errors | Check DCGM metrics, datacenter cooling |
| 5 (vLLM) | Storage for model weights, or memory sizing | Part 6, Category D |
Conclusion: From GPU Cluster Validation to Real AI Workloads
Successfully installing NVIDIA GPUs in Kubernetes is only the beginning. Before a GPU cluster supports production AI workloads, every layer should be tested with increasingly realistic workloads.
In this guide, Falcon AI progressed through five validation stages: CUDA VectorAdd, PyTorch, NCCL, gpu-burn, and vLLM inference. Each test validated a different part of the stack and provided a clear troubleshooting checkpoint.
As a result, the cluster is no longer simply “installed.” It has been tested from basic CUDA execution through distributed GPU communication and real LLM inference.
With these tests complete, the infrastructure is ready for the next stage: building the AI platform and application layer for ML engineers.
Need Help Building NVIDIA GPU & Kubernetes Infrastructure?
Planning or deploying NVIDIA GPU infrastructure, Kubernetes GPU clusters, AI platforms, or enterprise AI infrastructure?
Trezbon can help organizations design, deploy, validate, and optimize scalable GPU and Kubernetes environments for AI workloads.
👉 Talk to our infrastructure consultants:
https://trezbon.com/#contact
Next in the series: Part 8 — The AI Platform & Application Layer, where we install Kubeflow, KServe, Ray, and the MPI Operator — the layer that sits above everything we’ve built so far and turns raw GPU capacity into a self-service platform for Falcon AI’s ML teams.
Kubernetes GPU Scheduling: RuntimeClass, Affinity & Gang Scheduling
Kubernetes CNI Networking Explained: Pod Networks, CNI & Flannel
NVIDIA GPU Node on Kubernetes: 4-Layer Architecture & Troubleshooting
About Author

abhishek
Cloud Platform Lead and AI Infrastructure Architect at e& enterprise, with 12+ years in data center, virtualization, security and AI infrastructure. I design and build private cloud and sovereign AI platforms, working with VMware (NSX-T, vSphere, vSAN, HCX, AVS, SRM), Kubernetes, Terraform and GPU inference infrastructure for LLMs. Previously served Networkers Home (CCIE instructor, trained around 50 CCIEs), VCE/EMC2, Cisco, VMware and Arista across TAC, consulting, design and training. Certifications: CCIE#48639 (Data Center and R&S), VCIX-DCV and NV, CKA, NVIDIA AI Infrastructure, Azure Solutions Architect Expert, Terraform Associate, Palo Alto PCNSE. LinkedIn: https://www.linkedin.com/in/abhishekkunal51/