NVIDIA GPU Kubernetes Cluster Validation: Complete Readiness Checklist | Part 6
NVIDIA GPU Kubernetes Cluster Validation
Installing an NVIDIA GPU Kubernetes cluster is only the first step. Before running production AI or machine learning workloads, you need to confirm that every critical layer is healthy.
In Part 5 of the Falcon AI workbook series, we examined the four layers running on each GPU worker node. Now, in Part 6, we move from component-level checks to complete NVIDIA GPU Kubernetes cluster validation.
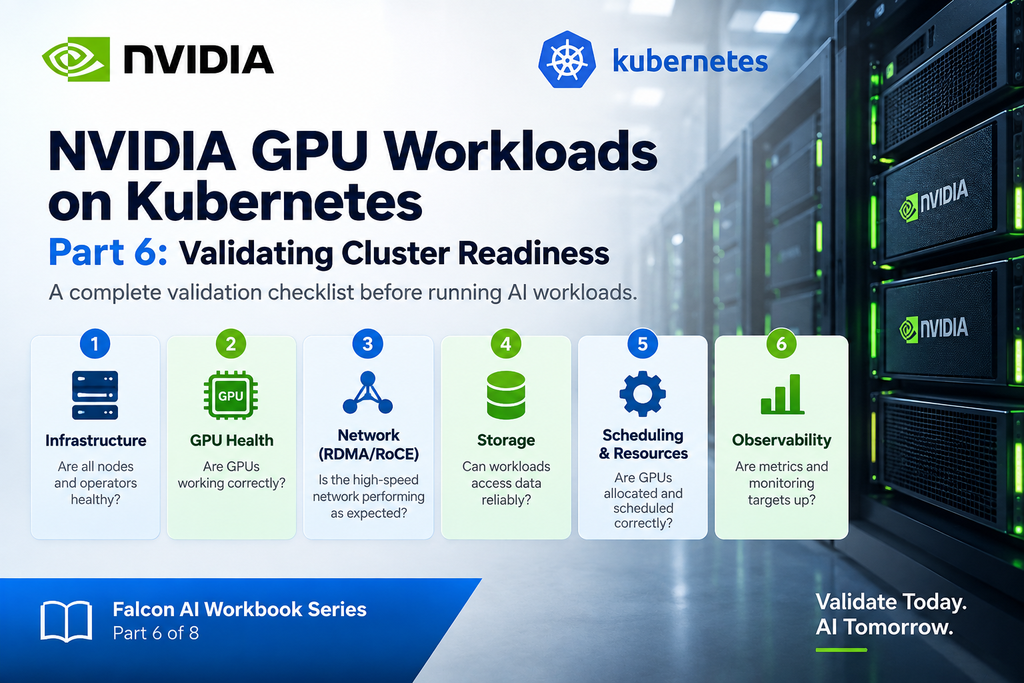
This guide covers six essential validation categories: infrastructure, GPU health, RDMA networking, storage, scheduling, and observability.
Most importantly, each category includes commands and clear pass/fail criteria. Therefore, you can identify potential problems before they affect a long-running AI training workload.
Think of this checklist as the final readiness gate before Part 7, where we start running real GPU test jobs.
Prerequisite
You’ve completed Part 5: you understand the four-layer stack on
gpu-wk-01/gpu-wk-02and have manually confirmed the driver, toolkit, device plugin, and DCGM exporter individually. This post assembles a repeatable checklist out of that knowledge — treat it as the gate before Part 7’s test job.
Recap: where Falcon AI stands
| Role | Count | Hostnames | Status after Part 5 |
|---|---|---|---|
| Management (control plane) | 3 | mgmt-01, mgmt-02, mgmt-03 | Ready, tainted NoSchedule |
| GPU worker | 2 | gpu-wk-01, gpu-wk-02 | Ready, full 4-layer stack confirmed |
| Load balancer | 1 | k8s-lb | Fronting API server on :6443 |
Why a formal checklist, not ad-hoc spot checks
Part 5 taught you to reason about the stack layer by layer when something’s already broken. This post is different — it’s the systematic pass you run before anything’s known to be broken, so you catch the quiet failures (a MIG partition silently not applied, a storage class with no default, RDMA counters showing errors under load) that don’t throw obvious errors but will absolutely ruin a multi-day training run.

Run these in order — each category assumes the ones before it passed. All commands run from mgmt-01 unless noted.
A. Infrastructure
kubectl get nodes
kubectl get pods -A
kubectl get ds -A
kubectl get crd
Pass criteria: all 5 nodes Ready; no pods stuck Pending/CrashLoopBackOff in gpu-operator or network-operator namespaces; every DaemonSet shows DESIRED == READY (specifically nvidia-driver-daemonset, nvidia-container-toolkit-daemonset, nvidia-device-plugin-daemonset should each read 2/2 — one per GPU node).
Once the Kubernetes infrastructure is healthy, the next step is to verify the GPUs themselves.
B. GPU & Device Health
Run these inside the driver/toolkit pod on each GPU node, or via kubectl exec:
kubectl exec -it -n gpu-operator <driver-pod-gpu-wk-01> -- nvidia-smi
kubectl exec -it -n gpu-operator <driver-pod-gpu-wk-01> -- nvidia-smi topo -m
kubectl exec -it -n gpu-operator <driver-pod-gpu-wk-01> -- dcgmi discovery -l
kubectl exec -it -n gpu-operator <driver-pod-gpu-wk-01> -- nvidia-smi -L
Pass criteria: nvidia-smi lists all 8 H100s with no ERR! in the ECC/Xid columns; nvidia-smi topo -m shows NV# (NVLink) connectivity between GPU pairs, not PHB/SYS for GPUs that should be NVLink-connected — this matters a lot for Falcon AI’s multi-GPU training performance; dcgmi discovery -l enumerates all 8 devices.
If MIG is enabled, add
nvidia-smi -Lto confirm the expected MIG instance layout is actually present — this is the “quiet failure” mentioned above. A MIG config that silently didn’t apply still shows the parent GPU as healthy.After confirming GPU health, validate the high-speed network that connects the GPU workers.
C. Network (RDMA/IB/RoCE)
This category exists specifically because of Falcon AI’s 400Gb RoCE NICs — skip it entirely if your cluster has no RDMA hardware.
kubectl exec -it -n network-operator <ofed-pod-gpu-wk-01> -- ibstat
kubectl exec -it -n network-operator <ofed-pod-gpu-wk-01> -- ibv_devices
kubectl exec -it -n network-operator <ofed-pod-gpu-wk-01> -- ib_write_bw
kubectl exec -it -n network-operator <ofed-pod-gpu-wk-01> -- ib_send_bw
kubectl exec -it -n network-operator <ofed-pod-gpu-wk-01> -- nccl-tests/build/all_reduce_perf -b 8M -e 128M -f 2 -g 8
Pass criteria: ibstat shows port State: Active, Physical state: LinkUp; ib_write_bw/ib_send_bw between gpu-wk-01 and gpu-wk-02 report bandwidth close to the NIC’s rated 400Gb (accounting for realistic overhead — expect roughly 80-90% of line rate); all_reduce_perf completes without errors and reports a busbw figure you can baseline against for future regression checks.
Next, verify that workloads can reliably access the storage required for datasets, model weights, and checkpoints.
D. Storage
kubectl get sc
kubectl get pvc -A
kubectl exec -it -n gpu-operator <driver-pod-gpu-wk-01> -- mount | grep <mount-point>
kubectl exec -it -n gpu-operator <driver-pod-gpu-wk-01> -- df -h
kubectl exec -it -n gpu-operator <driver-pod-gpu-wk-01> -- fio --name=test --filename=/mnt/testfile --rw=randread --size=1G --numjobs=4
Pass criteria: at least one StorageClass exists and is marked (default); PVCs bind to Bound status, not stuck Pending; fio completes and reports throughput sufficient for your dataset-loading pattern (this is highly workload-dependent — for LLM checkpoint I/O, sequential read/write throughput matters more than random IOPS).
With compute, networking, and storage validated, the next step is to confirm that Kubernetes can schedule GPU resources correctly.
E. Scheduling & Resources
kubectl describe node gpu-wk-01 | grep -A10 "Capacity\|Allocatable"
kubectl describe node gpu-wk-01 | grep -A3 "Taints\|Tolerations"
kubectl get runtimeclass
Pass criteria: Allocatable shows nvidia.com/gpu: 8 (or the correct MIG-sliced resource names, e.g. nvidia.com/mig-1g.10gb, if MIG is active); nvidia RuntimeClass exists and is available for pods to reference; management nodes still carry the NoSchedule taint from Part 1 — confirm it hasn’t drifted.
Finally, validate the monitoring layer. A production-ready GPU cluster must not only run workloads—it must also provide visibility into GPU and node health.
F. Observability
bash
kubectl get pods -n monitoring   # or wherever Prometheus Operator lands — covered in a later post
kubectl -n monitoring get targets 2>/dev/null || kubectl -n monitoring port-forward svc/prometheus-k8s 9090:9090
Pass criteria: Prometheus targets for dcgm-exporter and node-exporter show state: up; Grafana dashboards (once deployed — see the Observability post later in this series) render live GPU utilization data. If you haven’t installed the Prometheus Operator yet, note this category as deferred rather than skipped — we build it out properly in a dedicated post.
The full cheat sheet, one place
| Category | Command | Pass signal |
|---|---|---|
| Cluster | kubectl get nodes -o wide | All Ready |
| GPU | nvidia-smi topo -m | NVLink between expected pairs |
| Node capacity | kubectl describe node <node> | grep -A10 Capacity | Correct GPU count |
| Network | ibv_devices | RDMA device listed |
| Storage | kubectl get sc | Default class exists |
| Logs/Metrics | kubectl -n monitoring get targets | Exporters up |
Troubleshooting checkpoint
If any single category fails, stop and fix it before proceeding to Part 7 — running a distributed training test job against a cluster with a category-C (network) failure, for example, will produce a job that “works” but silently trains at a fraction of expected throughput, which is a much harder problem to diagnose after the fact than catching it here.
Troubleshooting Checkpoint
If any validation category fails, stop and resolve the issue before proceeding to Part 7.
For example, a network validation failure may not prevent a distributed training job from running. However, the workload could operate at only a fraction of its expected throughput.
As a result, the cluster may appear healthy while delivering poor performance.
Therefore, validate each category independently and resolve failures at this stage. Doing so is much easier than troubleshooting performance problems after production AI workloads have started.
Conclusion: Is Your NVIDIA GPU Kubernetes Cluster Ready?
A Kubernetes cluster showing Ready nodes and Running pods does not automatically mean it is ready for demanding AI workloads.
Before production deployment, you need to validate the complete infrastructure.
In this guide, we checked six critical areas: Kubernetes infrastructure, NVIDIA GPU health, RDMA networking, storage, GPU scheduling, and observability. Together, these checks provide a repeatable NVIDIA GPU Kubernetes cluster readiness checklist.
More importantly, the validation process can identify problems such as incorrect MIG configurations, RDMA performance issues, storage bottlenecks, resource allocation errors, and missing monitoring targets before they affect real workloads.
With all six categories passing, the Falcon AI cluster is no longer simply installed—it is validated and ready for GPU workload testing.
Next, in Part 7, we move from infrastructure validation to execution by running real NVIDIA GPU workloads on Kubernetes.
Need Help with NVIDIA GPU & Kubernetes Infrastructure?
Building or scaling an enterprise NVIDIA GPU cluster, Kubernetes AI platform, or high-performance AI infrastructure?
Trezbon can help with architecture, deployment, integration, validation, optimization, and enterprise infrastructure consulting.
👉 Talk to Trezbon about your NVIDIA GPU and Kubernetes requirements:
https://trezbon.com/#contact
Where we are
✅ Ran all six validation categories against the Falcon AI cluster ✅ Confirmed GPU, network, storage, and scheduling are all genuinely healthy — not just “pods are Running” ✅ Have a repeatable cheat sheet to re-run after any change (driver upgrade, new node, MIG reconfiguration)
Next in the series: Part 7 — Running a Test Job, where we climb the validation ladder for real: CUDA VectorAdd → PyTorch sample → NCCL test → gpu-burn → a vLLM inference smoke test.
NVIDIA GPU Workloads on Kubernetes: Build a Ready Cluster
NVIDIA GPU Workloads on Kubernetes Part 7: Running GPU Test Jobs
NVIDIA GPU Node on Kubernetes: 4-Layer Architecture & Troubleshooting
About Author

abhishek
Cloud Platform Lead and AI Infrastructure Architect at e& enterprise, with 12+ years in data center, virtualization, security and AI infrastructure. I design and build private cloud and sovereign AI platforms, working with VMware (NSX-T, vSphere, vSAN, HCX, AVS, SRM), Kubernetes, Terraform and GPU inference infrastructure for LLMs. Previously served Networkers Home (CCIE instructor, trained around 50 CCIEs), VCE/EMC2, Cisco, VMware and Arista across TAC, consulting, design and training. Certifications: CCIE#48639 (Data Center and R&S), VCIX-DCV and NV, CKA, NVIDIA AI Infrastructure, Azure Solutions Architect Expert, Terraform Associate, Palo Alto PCNSE. LinkedIn: https://www.linkedin.com/in/abhishekkunal51/